title: “AI Tool Guide” description: “Technical guide and comparison.” date: 2026-05-19T00:00:00+08:00 lastmod: 2026-05-19T00:00:00+08:00 tech_stack: [] application_domain: Dev Utils source_version: ’' licensing_model: Open Source license_type: AGPL-3.0 file_size: ’' file_md5: ’' download_url: ’' backup_url: ’' last_maintained: “2026-05-19” draft: false categories: [“dev-utils”] tags: [“grafana”, “docker”, “monitoring”, “prometheus”, “observability”, “dashboard”, “devops”] aliases:
- /posts/grafana/-
Every production incident starts with a question: “What changed?” Without a centralized view of your metrics, logs, and traces, that question takes minutes — sometimes hours — to answer. Grafana, the open-source visualization platform with 73,876 GitHub stars, turns that question into a glanceable dashboard. This guide walks through production-grade Docker deployment, data source integration, and the hardening decisions that separate a proof-of-concept from a production-ready monitoring stack.
What Is Grafana?
Grafana is an open-source platform for monitoring and observability that visualizes data from 100+ sources — time-series databases, log aggregators, tracing backends, and cloud APIs — in unified, shareable dashboards. Originally launched in 2014 by Torkel Ödegaard as a frontend for Graphite, Grafana has evolved into the visualization layer of choice for the LGTM stack (Loki, Grafana, Tempo, Mimir) and the broader cloud-native observability ecosystem.
How Grafana Works
Grafana operates as a stateless visualization layer between your data sources and your operations team. It does not store metrics or logs itself; instead, it queries external data sources via their native APIs and renders the results into panels, dashboards, and alerts.
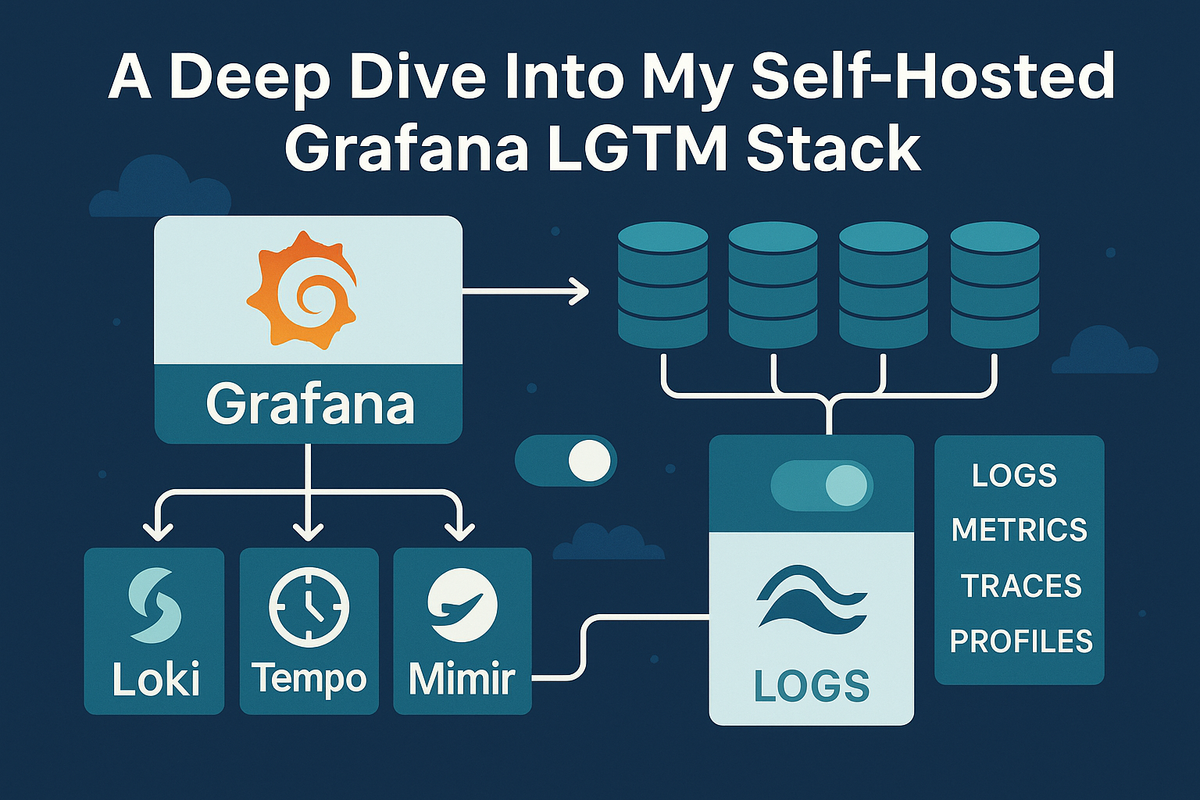
Core Architecture Components:
- Data Sources — Native plugins for Prometheus, Loki, InfluxDB, Elasticsearch, CloudWatch, Azure Monitor, and 100+ others
- Query Engine — Each panel executes queries in the native language of its data source (PromQL, LogQL, InfluxQL, Lucene)
- Alerting Engine — Evaluates alert rules against query results and routes notifications to Slack, PagerDuty, email, webhooks
- Dashboard Model — JSON-based dashboard definitions that can be version-controlled, provisioned from Git, or imported from the community library
- Authentication Layer — Supports OAuth, LDAP, SAML, and API key access for multi-tenant deployments
The typical data flow looks like this: Prometheus scrapes metrics from your applications and Node Exporter, Loki aggregates logs from Promtail or Fluentd, and Grafana queries both to render correlated dashboards where a spike in CPU (metrics) and an error spike (logs) appear side by side.
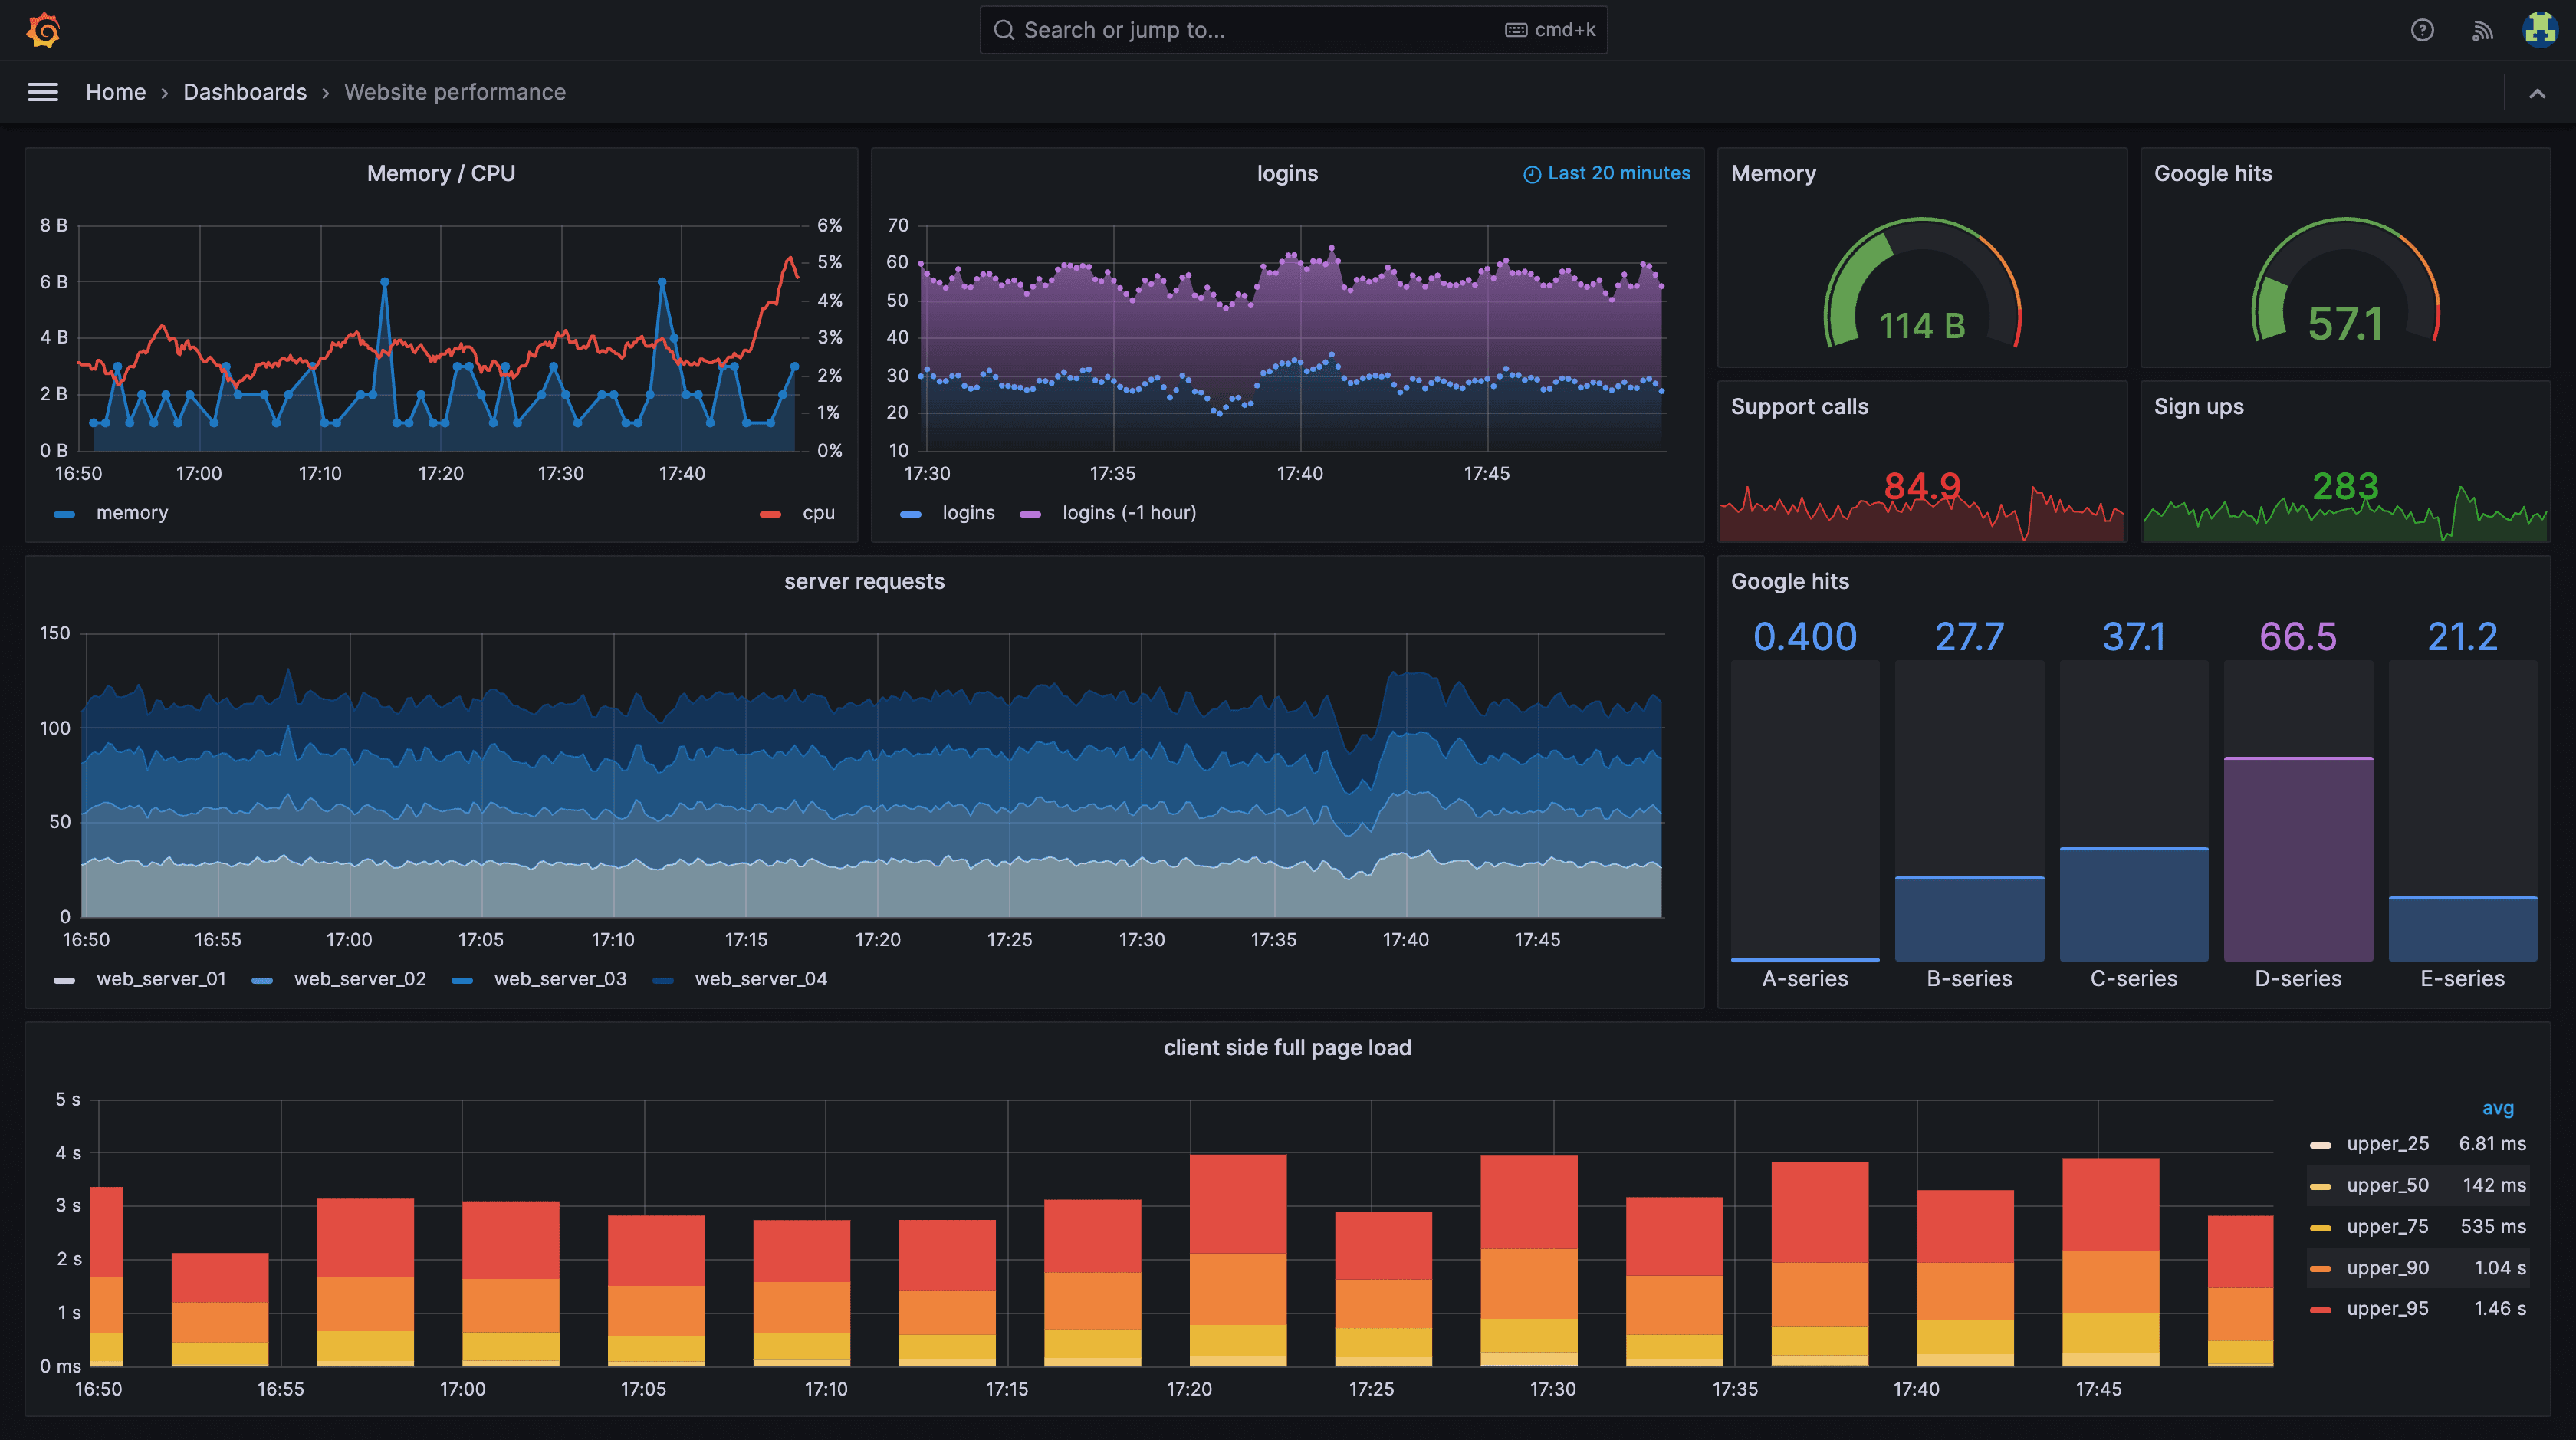
A typical production Grafana dashboard combines multiple panel types — time-series graphs for CPU/memory, stat panels for current values, log streams for real-time errors, and alert annotations for incident correlation — all querying different data sources in a single view.
Installation & Setup
Docker CLI — Single Container (30 Seconds)
The fastest way to get Grafana running for local exploration: ````bash
Create a persistent volume for Grafana data
docker volume create grafana-storage
Run the latest stable Grafana Enterprise image
docker run -d
-p 3000:3000
–name=grafana
–volume grafana-storage:/var/lib/grafana
grafana/grafana-enterprise
Navigate to ````http://localhost:3000````. Default credentials are ````admin```` / ````admin````. You will be prompted to change the password on first login.

### Docker Compose — Production-Ready Stack

For a production-grade monitoring stack, combine Grafana with Prometheus and Loki. Create the following directory structure: `````bash
mkdir -p ~/grafana-stack/{prometheus,loki,grafana/provisioning/datasources,grafana/provisioning/dashboards,grafana/dashboards}
cd ~/grafana-stack
docker-compose.yml:
version: "3.8"

services: grafana: image: grafana/grafana-enterprise:11.6.0
    container_name: grafana
    restart: unless-stopped
    ports: - "3000:3000"
    environment: - GF_SECURITY_ADMIN_USER=${GRAFANA_ADMIN_USER:-admin}
      - GF_SECURITY_ADMIN_PASSWORD=${GRAFANA_ADMIN_PASSWORD:-admin}
      - GF_USERS_ALLOW_SIGN_UP=false
      - GF_SERVER_ROOT_URL=https://grafana.yourdomain.com
      - GF_INSTALL_PLUGINS=grafana-clock-panel,grafana-piechart-panel
    volumes: - grafana-data:/var/lib/grafana
      - ./grafana/provisioning:/etc/grafana/provisioning
      - ./grafana/dashboards:/var/lib/grafana/dashboards
    networks: - monitoring
    depends_on: - prometheus
      - loki

  prometheus: image: prom/prometheus:v3.2.0
    container_name: prometheus
    restart: unless-stopped
    ports: - "9090:9090"
    volumes: - ./prometheus/prometheus.yml:/etc/prometheus/prometheus.yml
      - prometheus-data:/prometheus
    command: - '--config.file=/etc/prometheus/prometheus.yml'
      - '--storage.tsdb.path=/prometheus'
      - '--storage.tsdb.retention.time=30d'
      - '--web.enable-lifecycle'
    networks: - monitoring

  loki: image: grafana/loki:3.4.0
    container_name: loki
    restart: unless-stopped
    ports: - "3100:3100"
    volumes: - ./loki/loki-config.yml:/etc/loki/local-config.yaml
      - loki-data:/loki
    command: -config.file=/etc/loki/local-config.yaml
    networks: - monitoring

  promtail: image: grafana/promtail:3.4.0
    container_name: promtail
    restart: unless-stopped
    volumes: - /var/log:/var/log:ro
      - ./loki/promtail-config.yml:/etc/promtail/config.yml
    command: -config.file=/etc/promtail/config.yml
    networks: - monitoring

volumes: grafana-data: prometheus-data: loki-data: networks: monitoring: driver: bridge
prometheus/prometheus.yml:
global: scrape_interval: 15s
  evaluation_interval: 15s

scrape_configs: - job_name: prometheus
    static_configs: - targets: [localhost:9090]

  - job_name: 'node-exporter'
    static_configs: - targets: [node-exporter:9100]

  - job_name: grafana
    static_configs: - targets: [grafana:3000]
loki/loki-config.yml:
auth_enabled: false

server: http_listen_port: 3100
  grpc_listen_port: 9096

ingester: wal: enabled: true
    dir: /loki/wal
  lifecycler: address: 127.0.0.1
    ring: kvstore: store: inmemory
      replication_factor: 1
    final_sleep: 0s
  chunk_idle_period: 5m
  chunk_retain_period: 30s

schema_config: configs: - from: 2020-05-15
      store: tsdb
      object_store: filesystem
      schema: v13
      index: prefix: index_
        period: 24h

storage_config: tsdb_shipper: active_index_directory: /loki/index
    cache_location: /loki/cache
  filesystem: directory: /loki/chunks

compactor: working_directory: /loki/compactor
  retention_enabled: true
  retention_delete_delay: 2h

limits_config: retention_period: 720h
loki/promtail-config.yml:
server: http_listen_port: 9080
  grpc_listen_port: 0

positions: filename: /tmp/positions.yaml

clients: - url: http://loki:3100/loki/api/v1/push

scrape_configs: - job_name: system-logs
    static_configs: - targets: - localhost
        labels: job: system-logs
          __path__: /var/log/*.log
Start the stack: `````bash docker compose up -d
Access Grafana at ````http://your-server-ip:3000````. Prometheus is available on port 9090, Loki on port 3100.

### Provisioning Data Sources Automatically

Instead of manually clicking through the UI to add data sources, use Grafana's provisioning system. Create ``grafana/provisioning/datasources/datasources.yml``: `````yaml
apiVersion: 1

datasources: - name: Prometheus
    type: prometheus
    access: proxy
    url: http://prometheus:9090
    isDefault: true
    editable: false

  - name: Loki
    type: loki
    access: proxy
    url: http://loki:3100
    editable: false

  - name: Tempo
    type: tempo
    access: proxy
    url: http://tempo:3200
    editable: false
Restart Grafana and the data sources will appear pre-configured: `````bash docker compose restart grafana
## Integration with Prometheus, Loki, InfluxDB, and Elasticsearch

### Prometheus — Metrics Dashboard

Prometheus is the de facto metrics source for Grafana. A typical CPU monitoring panel uses PromQL: `````promql
# CPU usage percentage
100 - (avg by(instance) (irate(node_cpu_seconds_total{mode="idle"}[5m])) * 100)

# Memory usage
100 * (1 - ((node_memory_MemAvailable_bytes or node_memory_Buffers_bytes) / node_memory_MemTotal_bytes))

# Disk usage
100 - ((node_filesystem_avail_bytes{mountpoint="/"} * 100) / node_filesystem_size_bytes{mountpoint="/"})
Import the official Node Exporter Full dashboard (ID: 1860) from the Grafana dashboard library for 115+ pre-built system metrics panels.
Loki — Log Aggregation
Loki integrates log lines alongside metrics in the same dashboard. A LogQL query to find error lines: `````logql
Count error logs per application
sum by(app) (rate({job=“system-logs”} |= “ERROR” [5m]))
Search for specific error patterns
{job=“system-logs”} |~ “(?i)error|exception|fatal” | json | line_format ""
### InfluxDB — Time-Series Data

For IoT and high-cardinality metrics workloads, InfluxDB pairs well with Grafana: `````sql
-- InfluxQL example: average temperature per sensor
SELECT mean("temperature") FROM "sensors" WHERE $timeFilter GROUP BY "sensor_id", time($__interval) fill(null)
Elasticsearch — Log Search
For teams already invested in the Elastic Stack, Grafana can query Elasticsearch indices directly: `````json { “query”: { “bool”: { “must”: [ { “match”: { “level”: “ERROR” } }, { “range”: { “@timestamp”: { “gte”: “now-1h” } } } ] } } }
## Benchmarks / Real-World Use Cases

**Performance Characteristics at Scale:**

| Metric | Single Instance (Docker) | HA Pair (K8s) |
|
* * *
|
* * *
|
* * *
|
| Dashboard load time | 50-200ms | 30-100ms |
| Concurrent users | 50-100 | 500+ |
| Max data points per panel | 10,000-50,000 | 100,000+ |
| Alert rule evaluation | 1-10s | <5s |
| Memory usage | 256-512MB | 512MB-1GB per pod |

**Netflix** runs Grafana at massive scale across thousands of microservices, using custom data source plugins to correlate metrics from multiple internal systems. **PayPal** uses Grafana with Prometheus to monitor 200,000+ containers. **eBay** replaced a legacy commercial monitoring tool with Grafana, reducing dashboard creation time from days to hours.

A mid-size e-commerce platform (50 hosts, 2M active series) running self-hosted Grafana with Prometheus and Loki typically sees: - Monthly infrastructure cost: $200-500 (compute + storage)
- Equivalent Datadog cost: $9,500+/month
- Dashboard creation time: 30 minutes vs. 2+ hours with custom UIs
- Mean time to detection (MTTD): Reduced by 40-60% after Grafana adoption

## Advanced Usage / Production Hardening

### SSL/TLS Termination with Reverse Proxy

Never expose Grafana directly to the internet. Use Traefik or Nginx as a reverse proxy: `````yaml
# docker-compose.yml addition
  traefik: image: traefik:v3.3
    command: - "--api.insecure=true"
      - "--providers.docker=true"
      - "--entrypoints.websecure.address=:443"
      - "--certificatesresolvers.letsencrypt.acme.tlschallenge=true"
      - "--certificatesresolvers.letsencrypt.acme.email=admin@yourdomain.com"
      - "--certificatesresolvers.letsencrypt.acme.storage=/letsencrypt/acme.json"
    ports: - "443:443"
    volumes: - /var/run/docker.sock:/var/run/docker.sock:ro
      - ./letsencrypt:/letsencrypt
    networks: - monitoring
High Availability Setup
For production environments requiring zero downtime: `````yaml
Grafana HA requires a shared database (PostgreSQL or MySQL)
and multiple Grafana instances behind a load balancer
postgres: image: postgres:17-alpine environment: POSTGRES_DB: grafana POSTGRES_USER: grafana POSTGRES_PASSWORD: ${DB_PASSWORD} volumes: - postgres-data:/var/lib/postgresql/data
grafana-1: image: grafana/grafana-enterprise:11.6.0 environment: - GF_DATABASE_TYPE=postgres - GF_DATABASE_HOST=postgres:5432 - GF_DATABASE_NAME=grafana - GF_DATABASE_USER=grafana - GF_DATABASE_PASSWORD=${DB_PASSWORD} - GF_REMOTE_CACHE_TYPE=redis - GF_REMOTE_CACHE_CONNSTR=redis:6379 depends_on: - postgres

Grafana's alerting timeline dashboard visualizes alert firing patterns over time, helping teams identify noisy alerts and correlation between different alert rules during incident response.
### Alerting Configuration as Code
Define alert rules via provisioning: `````yaml
# grafana/provisioning/alerting/alert-rules.yml
apiVersion: 1
groups: - orgId: 1
name: infrastructure
folder: Infrastructure
interval: 60s
rules: - uid: high-cpu-usage
title: CPU Usage Above 80%
condition: B
data: - refId: A
relativeTimeRange: from: 300
to: 0
datasourceUid: prometheus
model: expr: 100 - (avg by(instance) (irate(node_cpu_seconds_total{mode="idle"}[5m])) * 100) > 80
noDataState: NoData
execErrState: Error
for: 5m
annotations: summary: "High CPU usage on "
Dashboard Provisioning from Git
Store dashboards as JSON in your repository and provision them automatically: `````yaml
grafana/provisioning/dashboards/dashboards.yml
apiVersion: 1
providers: - name: default orgId: 1 folder: ’' type: file disableDeletion: false editable: false updateIntervalSeconds: 30 options: path: /var/lib/grafana/dashboards foldersFromFilesStructure: true
### Security Checklist

- Change the default admin password immediately
- Disable user signups: ````GF_USERS_ALLOW_SIGN_UP=false````
- Enable HTTPS with valid certificates
- Use OAuth 2.0 or LDAP for authentication in team environments
- Restrict data source proxy access to admin roles
- Enable audit logging: ````GF_AUDIT_ENABLED=true````
- Run Grafana as a non-root user in containers
- Keep plugins updated — vulnerable plugins are a common attack vector

## Comparison with Alternatives

| Feature | Grafana | Datadog | Kibana | New Relic |
|
* * *
|
* * *
|
* * *
|
* * *
|
* * *
|
| **Open Source** | Yes (AGPL-3.0) | No | Yes (SSPL) | No |
| **Self-Hosted Option** | Yes, free | No | Yes | No |
| **Data Sources** | 100+ native | 750+ integrations | Elasticsearch only | 100+ |
| **Metrics (Time-Series)** | Excellent (Prometheus) | Excellent | Good | Good |
| **Log Analysis** | Good (via Loki) | Excellent | Excellent (Lucene) | Good |
| **APM / Distributed Tracing** | Via Tempo/Jaeger plugins | Excellent (built-in) | Via Elastic APM | Excellent |
| **Dashboard Flexibility** | Excellent | Good | Good | Good |
| **Alerting** | Good | Excellent | Basic | Good |
| **Setup Complexity** | Medium | Low | Medium-High | Low |
| **Cost (50 hosts/month)** | $0-500 self-hosted | $9,500-20,000 | $500-1,500 self-hosted | $7,500-15,000 |
| **Community / Ecosystem** | Massive (73K+ stars) | Large | Large (Elastic) | Medium |

**When to choose what:**

- **Grafana** — Cost-sensitive teams, Kubernetes-native environments, multi-source observability needs, platform engineering maturity
- **Datadog** — Enterprise teams prioritizing time-to-value, teams without dedicated platform engineers, compliance-heavy industries
- **Kibana** — Deep log analysis requirements, SIEM use cases, existing Elasticsearch investment
- **New Relic** — Full-stack APM with generous free tier (100GB/month), user-based pricing model

## Limitations / Honest Assessment

Grafana is not a silver bullet. Understand these limitations before committing: 1. **No built-in data collection** — Grafana visualizes data; it does not collect it. You still need Prometheus, Loki, or another backend. This adds operational overhead compared to all-in-one SaaS platforms.

2. **Log search is not Lucene** — Loki uses label-based filtering with regex, not full-text search like Elasticsearch. Complex log queries can be slower and less intuitive.

3. **Alerting maturity** — Grafana's unified alerting (introduced in v8) has improved significantly but still lacks the sophistication of PagerDuty-native incident management or Datadog's AI-driven anomaly detection.

4. **Plugin maintenance risk** — Community plugins vary in quality and maintenance cadence. A plugin abandoned by its author can block Grafana upgrades.

5. **Setup requires expertise** — The LGTM stack requires understanding of PromQL, LogQL, Alertmanager routing, and Kubernetes if running in-cluster. This is not a click-to-deploy solution.

## Frequently Asked Questions

**Q1: Is Grafana completely free for commercial use?**

Yes. The open-source Grafana (AGPL-3.0) is free for commercial use. Grafana Enterprise adds features like advanced RBAC, data source permissions, and enterprise support at a cost. For most teams, the OSS edition is sufficient.

**Q2: Can Grafana replace Datadog entirely?**

It depends. For metrics, logs, and traces visualization, Grafana with the LGTM stack covers 80-90% of Datadog's functionality at a fraction of the cost. However, Datadog's APM depth, AI-driven anomaly detection, and out-of-the-box integrations remain superior for teams prioritizing speed over cost.

**Q3: How do I back up my Grafana dashboards?**

Dashboards are stored as JSON in Grafana's database. Use the API to export them: ````curl -H "Authorization: Bearer $API_KEY" http://grafana:3000/api/dashboards/uid/<uid>````. For GitOps workflows, provision dashboards from JSON files in version control.

**Q4: What is the difference between Grafana OSS and Grafana Enterprise?**

Grafana Enterprise adds enterprise data source plugins (Snowflake, SAP HANA, ServiceNow), advanced RBAC with fine-grained access control, reporting, and premium support. The core dashboard and visualization features are identical.

**Q5: How does Grafana scale for large organizations?**

Grafana scales horizontally by running multiple instances behind a load balancer with a shared PostgreSQL or MySQL database. For 500+ users, deploy on Kubernetes with the official Helm chart, use Redis for session caching, and consider Grafana Mimir for long-term metrics storage.

**Q6: Can I import dashboards from other tools?**

Yes. Grafana supports importing from Datadog, Kibana, and other tools through community converters. The native JSON dashboard format is well-documented, and the Grafana dashboard library contains 5,000+ community-contributed dashboards ready to import by ID.

**Q7: Does Grafana support real-time dashboards?**

Yes, with Grafana Live (WebSocket-based streaming) and the new Scenes framework. Refresh intervals can be set as low as 5 seconds for near real-time monitoring. For true real-time, use streaming data sources.

## Conclusion

Grafana earns its 73,876 GitHub stars by solving a concrete problem — unifying observability data from disparate sources into dashboards that teams actually want to use. The Docker-based deployment covered in this guide gets a production-grade monitoring stack running in under 30 minutes. For teams willing to invest in operational expertise, the cost savings over SaaS alternatives are substantial.

**Next steps:**

1. Clone the [Grafana GitHub repository](https://github.com/grafana/grafana) and explore the codebase
2. Deploy the Docker Compose stack from this guide on your infrastructure
3. Import dashboard ID ````1860``` (Node Exporter Full) for immediate system visibility
4. Join the [Grafana community forums](https://community.grafana.com/) for support
5. Follow the [dibi8 Telegram group](https://t.me/dibi8hub) for weekly dev tool deep dives

*This article contains affiliate links. If you purchase hosting through DigitalOcean or HTStack using our links, we earn a commission at no extra cost to you. This helps fund our open-source tooling reviews.*


## Recommended Hosting & Infrastructure

Before you deploy any of the tools above into production, you'll need solid infrastructure. Two options dibi8 actually uses and recommends: - **[DigitalOcean](https://m.do.co/c/eca87ac14ee0)** — $200 free credit for 60 days across 14+ global regions. The default option for indie devs running open-source AI tools.
- **[HTStack](https://my.htstack.com/aff.php?aff=27187)** — Hong Kong VPS with low-latency access from mainland China. This is the same IDC that hosts dibi8.com — battle-tested in production.

*Affiliate links — they don"t cost you extra and they help keep dibi8.com running.*

## Sources & Further Reading

- [Grafana Official Docker Documentation](https://grafana.com/docs/grafana/latest/setup-grafana/installation/docker/)
- [Grafana Provisioning Guide](https://grafana.com/docs/grafana/latest/administration/provisioning/)
- [Grafana GitHub Repository](https://github.com/grafana/grafana)
- [LGTM Stack Architecture](https://grafana.com/blog/2024/08/01/lgtm-stack/)
- [Prometheus Node Exporter Dashboard #1860](https://grafana.com/grafana/dashboards/1860)
- [Grafana vs Datadog Pricing Analysis 2026](https://tech-insider.org/grafana-vs-datadog-2026/)
- [Datadog Official Pricing](https://www.datadoghq.com/pricing/)
- [New Relic Pricing](https://newrelic.com/pricing)
- [DigitalOcean — Cloud VPS Hosting](https://www.digitalocean.com/)
- [HTStack — Managed Cloud Servers](https://htstack.com/)


{
  "@context": "https://schema.org",
  "@type": "Article",
  "headline": "Grafana: 73,876 GitHub Stars — Docker Deployment Guide 2026",
  "datePublished": "2026-05-19",
  "dateModified": "2026-05-19",
  "author": {
    "@type": "Organization",
    "name": "Dibi8"
  },
  "publisher": {
    "@type": "Organization",
    "name": "Dibi8",
    "logo": {
      "@type": "ImageObject",
      "url": "https://dibi8.com/logo.png"
    }
  },
  "mainEntityOfPage": {
    "@type": "WebPage",
    "@id": "https://dibi8.com/resources/grafana"
  }
}
</script>


* * *
## Related Articles

- [apple-container](grafana)
- [trivy-production-security-scanner-2026](grafana)
- [trivy-production-security-scanner-2026](grafana)
- [12-factor-agents](grafana)
- [12-factor-agents](grafana)


* * *
*Found this helpful? [Join our Telegram community](https://t.me/DIBI8_Group) for daily AI tool updates!*