title: “AI Tool Guide” description: “Technical guide and comparison.” date: 2026-05-19T00:00:00+08:00 lastmod: 2026-05-19T00:00:00+08:00 tech_stack: [] application_domain: Dev Utils source_version: ’' licensing_model: Open Source license_type: GPL-3.0 file_size: ’' file_md5: ’' download_url: ’' backup_url: ’' last_maintained: “2026-05-19” draft: false categories: [“dev-utils”] tags: [“netdata”, “monitoring”, “observability”, “performance-tuning”, “docker”, “kubernetes”, “real-time-metrics”] aliases:
- /posts/netdata/-
Introduction
Most monitoring tools show you what happened 30 seconds ago. By then, the microburst that killed your database connection pool is already gone — leaving only a cryptic log entry and an angry pager. Netdata closes that gap with per-second metrics, sub-2-second visualization latency, and a single binary that installs in under 60 seconds. With 78,874 GitHub stars and a GPL-3.0 license, it is one of the most popular open-source monitoring agents in production today. This guide walks through a complete Netdata setup — from a single-node Docker deployment to a streaming Kubernetes cluster — with real performance-tuning configurations you can apply immediately.
What Is Netdata?
Netdata is a distributed real-time monitoring agent that collects, stores, and visualizes system and application metrics with per-second granularity. Unlike traditional polling-based systems that sample every 15–60 seconds, Netdata runs directly on each node, capturing thousands of metrics locally and streaming them to central parents when needed. Written in C (54.2%), Go (29%), and Rust (8.5%), it is designed for minimal resource overhead: under 5% CPU and ~150 MB RAM per node in default configuration.
How Netdata Works
Netdata’s architecture follows an edge-first, distributed model. Each node runs an independent agent that auto-discovers 800+ integrations without configuration files.


Core components:
- Data Collection Layer: Built-in collectors for CPU, memory, disk, network, containers, databases, and applications. No external dependencies like Telegraf or Exporters required.
- Database Engine (dbengine): A custom high-performance time-series store using ~0.5 bytes per sample with tiered storage for long-term retention.
- ML Anomaly Detection: 18 unsupervised ML models per metric run at the edge, achieving consensus-based anomaly detection with 99% false-positive reduction.
- Streaming & Parent-Child: Any agent can act as a “parent” to aggregate metrics from child nodes, enabling horizontal scaling without central bottlenecks.
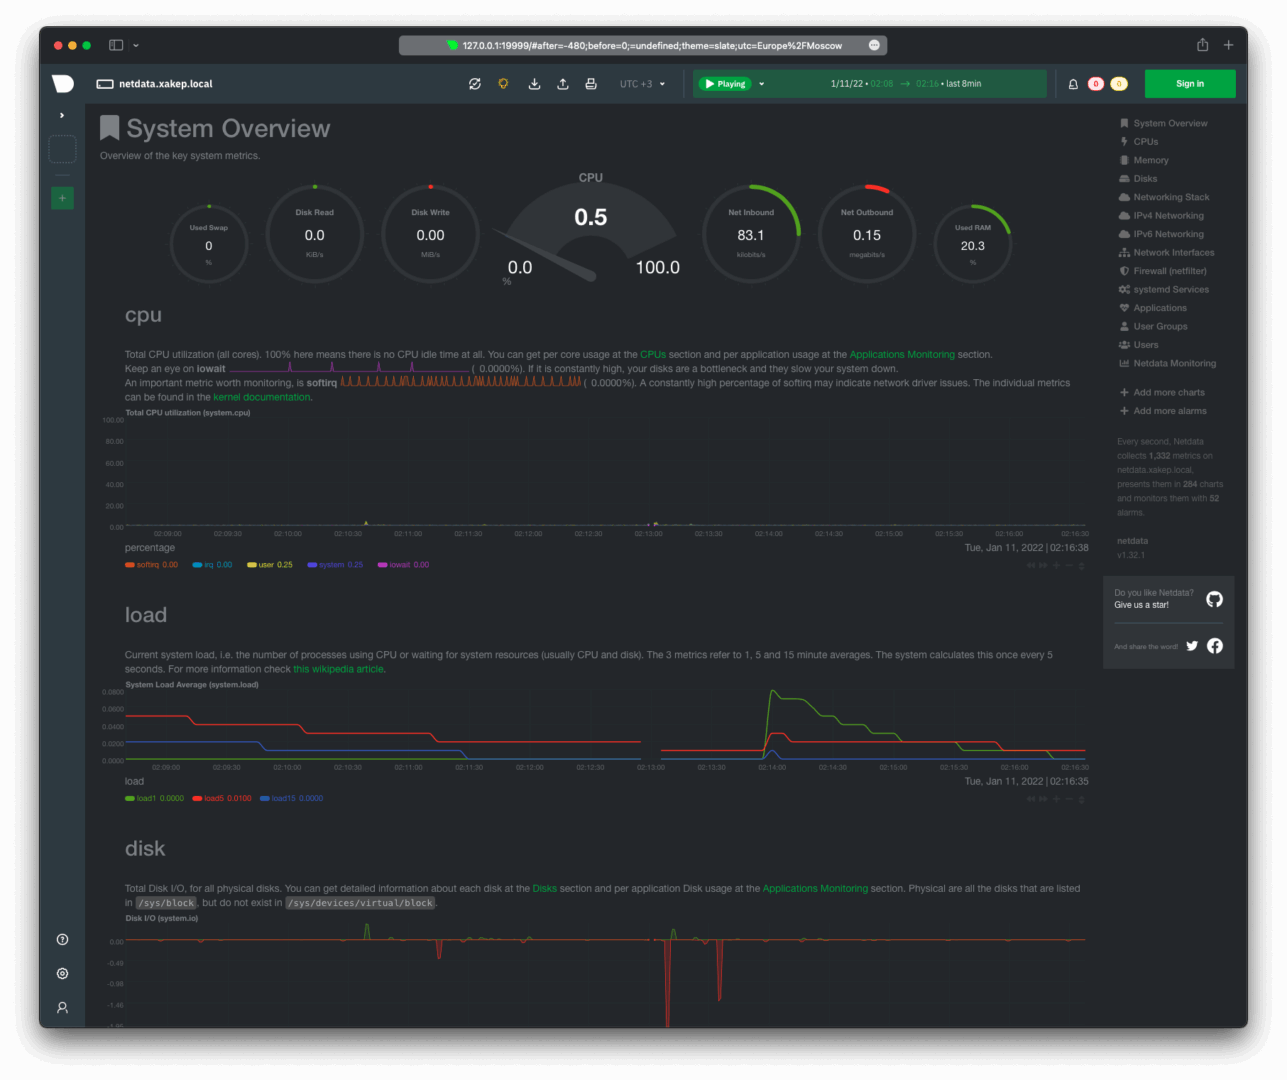
- Web Dashboard: Embedded static-threaded web server serves real-time charts directly from the agent on port 19999.
Installation & Setup
One-Line Install (Linux)
The fastest way to get Netdata running: ````bash
Install Netdata with all defaultscurl -Ss https://get.netdata.cloud/kickstart.sh | sudo bash
Verify the installation: `````bash
sudo systemctl status netdata
# Active: active (running) since ...
Access the local dashboard at http://localhost:19999.
Docker Deploy
For containerized environments: `````bash
docker run -d –name=netdata
-p 19999:19999
-v /proc:/host/proc:ro
-v /sys:/host/sys:ro
-v /var/run/docker.sock:/var/run/docker.sock:ro
–cap-add SYS_PTRACE
–security-opt apparmor=unconfined
netdata/netdata:latest
### Docker Compose (Production-Ready)
`````yaml
version: '3.8'
services: netdata: image: netdata/netdata:v2.5.0
container_name: netdata
hostname: "netdata-${HOSTNAME}"
ports: - "19999:19999"
restart: unless-stopped
cap_add: - SYS_PTRACE
- SYS_ADMIN
security_opt: - apparmor:unconfined
volumes: - /proc:/host/proc:ro
- /sys:/host/sys:ro
- /etc/os-release:/host/etc/os-release:ro
- /var/run/docker.sock:/var/run/docker.sock:ro
- netdata-config:/etc/netdata
- netdata-lib:/var/lib/netdata
- netdata-cache:/var/cache/netdata
environment: - NETDATA_CLAIM_TOKEN=${NETDATA_CLAIM_TOKEN}
- NETDATA_CLAIM_URL=https://app.netdata.cloud
- NETDATA_CLAIM_ROOMS=${NETDATA_CLAIM_ROOMS}
volumes: netdata-config: netdata-lib: netdata-cache: `````
### Kubernetes Helm Install
`````bash
# Add the Netdata Helm repository
helm repo add netdata https://netdata.github.io/helmchart/
helm repo update
# Install with default values
helm install netdata netdata/netdata \
--namespace monitoring \
--create-namespace
Verify the pods: `````bash kubectl get pods -n monitoring
NAME READY STATUS
netdata-parent-0 1/1 Running
netdata-child-xxx 1/1 Running
### Generate Current Config

Download the running configuration to customize: `````bash
# Download current effective config
curl -o /etc/netdata/netdata.conf http://localhost:19999/netdata.conf
# Or use the edit-config script
sudo /etc/netdata/edit-config netdata.conf
Integration with Popular Tools
Prometheus Remote Write
Export Netdata metrics to Prometheus for long-term storage and PromQL queries: `````bash sudo /etc/netdata/edit-config exporting.conf
`````conf
[prometheus:remote_write]
    enabled = yes
    destination = prometheus:9090
    remote write URL path = /api/v1/write
    data source = average
    prefix = netdata
    send charts matching = *
    send hosts matching = *
Restart Netdata: `````bash sudo systemctl restart netdata
### Grafana Dashboard

While Netdata has a built-in dashboard, many teams prefer Grafana for centralized visualization. Add Netdata as a Prometheus data source in Grafana: `````yaml
# datasource.yaml in Grafana
apiVersion: 1
datasources: - name: Netdata-Prometheus
    type: prometheus
    url: http://netdata:19999/api/v1/allmetrics?format=prometheus
    access: proxy
    isDefault: false
    jsonData: timeInterval: "1s"
Kubernetes DaemonSet (Advanced)
For full host-level visibility on every K8s node: `````yaml apiVersion: apps/v1 kind: DaemonSet metadata: name: netdata namespace: monitoring spec: selector: matchLabels: app: netdata template: metadata: labels: app: netdata spec: hostNetwork: true hostPID: true containers: - name: netdata image: netdata/netdata:v2.5.0 ports: - containerPort: 19999 hostPort: 19999 securityContext: capabilities: add: [SYS_PTRACE, SYS_ADMIN] volumeMounts: - name: proc mountPath: /host/proc readOnly: true - name: sys mountPath: /host/sys readOnly: true - name: docker-sock mountPath: /var/run/docker.sock readOnly: true volumes: - name: proc hostPath: path: /proc - name: sys hostPath: path: /sys - name: docker-sock hostPath: path: /var/run/docker.sock
### PostgreSQL Monitoring

Enable the PostgreSQL collector in ``go.d/postgres.conf``: `````yaml
jobs: - name: local
    dsn: 'postgres://netdata_monitor:password@localhost:5432/postgres'
    collect: - database_statistics
      - table_statistics
      - index_statistics
      - replication_statistics
    timeout: 2
Test the collector: `````bash sudo /etc/netdata/edit-config go.d/postgres.conf
Restart to apply
sudo systemctl restart netdata
### Nginx Monitoring

Monitor Nginx stub_status and access logs: `````yaml
# /etc/netdata/go.d/nginx.conf
jobs: - name: local
    url: http://localhost/stub_status

  - name: access_log
    path: /var/log/nginx/access.log
    parser: type: ltsv
Benchmarks / Real-World Use Cases
Resource Footprint Comparison
The University of Amsterdam published a peer-reviewed study (ICSOC 2023) ranking Netdata as the most energy-efficient monitoring tool for Docker-based systems. Independent benchmarks confirm: | Scenario | Netdata | Prometheus + Node Exporter | Zabbix Agent | |
|
|
|
| | CPU Overhead (%) | 1–5% | 5–15% | 10–20% | | RAM per Node | 100–150 MB | 200–500 MB | 150–300 MB | | Collection Interval | 1 second | 15–60 seconds | 30–60 seconds | | Startup Time | < 60 seconds | 30–60 minutes | 2–4 hours | | Metrics per Node | 2,000+ | 500–1,000 | 1,000–2,000 | | Config Required | Zero | Moderate | Extensive |
Streaming Scale Benchmarks
Netdata’s parent-child streaming architecture scales horizontally: - Single Parent: 1 million+ samples/second ingestion, ~3.5 GB RAM
- 10 Child Nodes: 20k metrics each, 1-second retention for 7 days, 12 GB disk
- Active-Active Cluster: Unlimited horizontal scaling with full data replication
- Ephemeral Nodes: Stream metrics to parents, retain data after node termination
Real-World Deployment: 500-Node K8s Cluster
A mid-size SaaS company running 500 Kubernetes nodes uses: - 5 Netdata parents (active-active) across 3 availability zones
- 500 child agents via DaemonSet, each running in RAM mode (~50 MB)
- Tiered storage: 1-second for 7 days, 1-minute for 1 month, 1-hour for 1 year
- Total parent storage: 25 GB per parent (125 GB cluster-wide)
- Alert routing via Netdata Cloud to PagerDuty and Slack
Advanced Usage / Production Hardening
Performance Tuning: netdata.conf
The default configuration is optimized for standalone use. For production systems, tune the database engine and disable unnecessary collectors.
Minimal footprint (production child nodes):
[global]
    # Run with lowest priority to avoid impacting applications
    process scheduling policy = batch
    process nice level = 19
    # Reduce threads on constrained nodes
    libuv worker threads = 4

[db]
    # Use RAM-only mode for child nodes streaming to parents
    mode = ram
    retention = 3600
    # Single tier is sufficient for local buffering
    storage tiers = 1

[ml]
    # Disable ML on child nodes — run on parents
    enabled = no

[health]
    # Disable local alerting on child nodes
    enabled = no

[web]
    # Bind only to localhost for security
    bind to = 127.0.0.1
    allow connections from = localhost

[plugins]
    # Disable unused collectors to reduce CPU/RAM
    ebpf = no
    perf = no
    nfacct = no
    fping = no
    ioping = no
    tc = no
    idlejitter = no
    debugfs = no
    systemd-journal = no
Parent node with tiered storage (central monitoring):
[db]
    mode = dbengine
    storage tiers = 3
    dbengine page cache size = 1.4GiB

    # Tier 0: 1-second resolution, 7 days
    update every = 1
    dbengine tier 0 retention size = 12GiB
    dbengine tier 0 retention time = 7d

    # Tier 1: 1-minute resolution, 1 month
    dbengine tier 1 update every iterations = 60
    dbengine tier 1 retention size = 4GiB
    dbengine tier 1 retention time = 1mo

    # Tier 2: 1-hour resolution, 1 year
    dbengine tier 2 update every iterations = 60
    dbengine tier 2 retention size = 2GiB
    dbengine tier 2 retention time = 1y

[ml]
    enabled = yes
    # 18 ML models per metric, trains every 3 hours
    train every = 10800
    number of models per dimension = 18

[health]
    enabled = yes
    # Run health checks every 10 seconds
    run at least every seconds = 10

[web]
    # Expose to network for dashboard access
    bind to = *
    # Restrict access to internal networks
    allow connections from = 10.* 192.168.* 172.16.* 172.17.*
Streaming Configuration: stream.conf
On child nodes (/etc/netdata/stream.conf): `````conf
[stream]
enabled = yes
destination = tcp:netdata-parent.monitoring.svc.cluster.local:19999
api key = YOUR_API_KEY_HERE
timeout seconds = 60
default port = 19999
send charts matching = *
buffer size bytes = 1048576
reconnect delay seconds = 5
initial clock resync iterations = 60
On the parent (``/etc/netdata/stream.conf``): `````conf
[API_KEY]
    enabled = yes
    default memory mode = dbengine
    health enabled by default = yes
Security Hardening
Enable TLS for the web interface: `````conf [web] tls version = 1.3 ssl key = /etc/netdata/ssl/key.pem ssl certificate = /etc/netdata/ssl/cert.pem # Require TLS for all connections bind to = *=dashboard|registry|badges|management|streaming|netdata.conf|readable|writable
### Monitoring Netdata Itself

Track the agent's own resource usage: `````bash
# View internal metrics
curl -s http://localhost:19999/api/v1/info | jq '.version, .hog'

# Check dbengine statistics
curl -s http://localhost:19999/api/v1/data?chart=netdata.dbengine_main_page_stats
Comparison with Alternatives
| Feature | Netdata | Prometheus | Datadog | Zabbix | |
|
|
|
|
| | Collection Interval | 1 second | 15–60 seconds | 15 seconds | 30–60 seconds | | Agent RAM | 100–150 MB | 200–500 MB | 200–400 MB | 150–300 MB | | Agent CPU | 1–5% | 5–15% | 3–8% | 10–20% | | Setup Time | < 60 seconds | 30–60 min | 10–20 min | 2–4 hours | | Auto-Discovery | 800+ integrations | Limited | 600+ integrations | Template-based | | Built-in Dashboard | Yes (real-time) | No (PromQL only) | Yes | Yes (dated) | | ML Anomaly Detection | 18 models/metric | No (requires extra) | Yes | Limited | | Long-Term Storage | Tiered dbengine | 15 days default | Cloud | External DB | | Licensing | GPL-3.0 (free) | Apache-2.0 (free) | $15/host/month | GPL-2.0 (free) | | Alert Routing | Built-in + Cloud | Alertmanager | Built-in | Built-in | | Kubernetes Native | Yes (Helm chart) | Yes (operator) | Yes (operator) | Limited |
When to choose what:
- Netdata: Single-node visibility, real-time troubleshooting, resource-constrained environments, teams that need zero-config monitoring.
- Prometheus: Cloud-native metric aggregation, complex PromQL queries, long-term storage with Thanos/VictoriaMetrics.
- Datadog: Enterprise-wide observability (metrics + logs + traces + APM), managed SaaS with SOC 2 compliance.
- Zabbix: Mixed infrastructure (network gear + servers + SNMP), organizations needing agent + agentless monitoring.
Limitations / Honest Assessment
Netdata is not the right tool for every monitoring scenario: 1. No centralized multi-host view without Netdata Cloud: The open-source agent dashboards are per-node. For a unified view across 100+ nodes, you either need Netdata Cloud (SaaS) or a parent streaming setup with external visualization. 2. Limited long-term storage in default config: The dbengine defaults to ~256 MB disk per tier. For years of retention at scale, you need explicit tiered storage configuration or an external TSDB like VictoriaMetrics. 3. Alerting pipeline less flexible than Alertmanager: While Netdata has built-in health checks and notifications, complex routing trees, silencing, and on-call rotation require Netdata Cloud or integration with PagerDuty/OpsGenie. 4. Not a full observability platform: Netdata focuses on metrics. For distributed tracing, structured logging, and APM, pair it with Jaeger, Loki, or OpenTelemetry. 5. Windows support is newer: The Windows agent is functional but has fewer collectors than Linux. For Windows-centric environments, verify collector coverage before deploying.
Frequently Asked Questions
Q: How much RAM does Netdata actually use in production?
On a child node streaming to a parent, ~50 MB with the RAM-mode configuration shown above. On a parent storing 7 days of 1-second data for 10 nodes, expect 2.5–3.5 GB RAM with a 1.4 GB page cache. The agent auto-tunes cache sizes based on available system memory.
Q: Can I run Netdata without Netdata Cloud?
Yes. The open-source agent is fully functional without any cloud connection. Use parent-child streaming for centralized aggregation and access dashboards directly on any agent at port 19999. Netdata Cloud adds unified dashboards, mobile apps, and advanced alert routing but is not required.
Q: How does Netdata compare to Prometheus + Grafana?
Netdata excels at real-time, per-node visibility with zero configuration. Prometheus excels at metric aggregation across dynamic, ephemeral fleets with PromQL. Many teams run both: Netdata on every node for real-time troubleshooting, Prometheus for cluster-level aggregation and long-term trending. Netdata can export metrics to Prometheus via OpenMetrics format.
Q: What is the maximum scale Netdata can handle?
A single parent node can ingest 1+ million samples/second. For horizontal scaling, deploy active-active parent clusters. There is no theoretical limit — the architecture is distributed by design. The Netdata Cloud SaaS handles millions of nodes.
Q: How do I back up Netdata’s database and configuration?
Configuration lives in /etc/netdata/ and can be version-controlled (Git, Ansible, Puppet). The dbengine database in /var/cache/netdata/ is self-healing and does not require manual backup — streaming to multiple parent nodes provides natural redundancy. For critical environments, run active-active parent pairs.
Q: Does Netdata support custom application metrics?
Yes. Use the built-in StatsD server (port 8125), the OpenMetrics endpoint, or write a custom collector in Python or Go. The go.d.plugin framework supports building new collectors with minimal boilerplate.
Conclusion
Netdata delivers on a promise most monitoring tools fail to keep: immediate, per-second visibility with negligible resource overhead. For teams running Docker, Kubernetes, or bare-metal infrastructure, it is the fastest path from “nothing” to “monitoring everything.” The streaming architecture scales from a single Raspberry Pi to a multi-region Kubernetes cluster, and the GPL-3.0 license means zero licensing costs.
Action items:
- Run the one-line installer on your most critical server today
- Deploy the Helm chart on your Kubernetes cluster
- Configure parent-child streaming for production hardening
- Tune ````netdata.conf``` for your resource constraints using the configs above
Join the Netdata community on Telegram for real-time support and discussions with 5,000+ engineers.
Affiliate disclosure: This article contains affiliate links for DigitalOcean and HTStack. If you purchase hosting services through these links, dibi8.com may receive a commission at no additional cost to you.
Recommended Hosting & Infrastructure
Before you deploy any of the tools above into production, you’ll need solid infrastructure. Two options dibi8 actually uses and recommends: - DigitalOcean — $200 free credit for 60 days across 14+ global regions. The default option for indie devs running open-source AI tools.
- HTStack — Hong Kong VPS with low-latency access from mainland China. This is the same IDC that hosts dibi8.com — battle-tested in production.
Affiliate links — they don"t cost you extra and they help keep dibi8.com running.
Sources & Further Reading
- Netdata GitHub Repository — 78,874 stars, GPL-3.0
- Official Documentation
- Netdata Helm Chart Reference
- Deployment Strategies & Parent-Child Streaming
- RAM Requirements & Sizing Guide
- Long-Term Data Retention Configuration
- Scaling Without Limits — Horizontal Architecture
- University of Amsterdam Energy Efficiency Study
- Netdata vs Zabbix Official Comparison
- Release Notes & Changelog
{ “@context”: “https://schema.org”, “@type”: “Article”, “headline”: “Netdata: Real-Time Monitoring with 78K+ Stars — Performance Tuning Guide for 2026”, “datePublished”: “2026-05-19”, “dateModified”: “2026-05-19”, “author”: { “@type”: “Organization”, “name”: “Dibi8” }, “publisher”: { “@type”: “Organization”, “name”: “Dibi8”, “logo”: { “@type”: “ImageObject”, “url”: “https://dibi8.com/logo.png" } }, “mainEntityOfPage”: { “@type”: “WebPage”, “@id”: “https://dibi8.com/resources/netdata" } }

Related Articles
- trivy-production-security-scanner-2026
- trivy-production-security-scanner-2026
- 12-factor-agents
- 12-factor-agents
- 12-factor-agents
Found this helpful? Join our Telegram community for daily AI tool updates!
Frequently Asked Questions (FAQ)
问:AI Agent和传统自动化有什么区别?
AI Agent具有自主决策能力,能够根据环境变化调整策略,而传统自动化只能执行预设规则。
问:如何选择合适的AI Agent框架?
考虑因素包括:部署难度、社区活跃度、扩展性、成本。Claude Code适合开发者,AutoGen适合复杂多智能体场景。
问:AI Agent的安全性如何保证?
实施权限最小化、输入验证、审计日志、以及定期安全评估。
问:AI Agent的学习成本有多高?
入门级使用3-5天,高级配置需要2-4周,取决于团队技术基础。
问:能否自定义AI Agent的行为?
是的,通过提示工程、工具定义、记忆系统、以及行为约束来定制。