Netdata: Giám Sát Thở Gian Thự 78K+ Star
Netdata (ND) là agent giám sát thở gian thực hiệu suất cao với metrics từng giây và khả năng trực quan hóa. Tương thích với Docker, Kubernetes, Prometheus và Grafana. Bao gồm hướng dẫn netdata, cài đặt netdata, giám sát thở gian thực, netdata vs prometheus, và tinh chỉnh hiệu suất netdata.
- GPL-3.0
- Cập nhật 2026-05-19
lang: vi slug: netdata title: ‘Netdata: Real-Time Monitoring with 78K+ Stars’ description: ‘Netdata (ND) is a high-performance real-time monitoring agent with per-second metrics and visualization. Compatible with Docker, Kubernetes, Prometheus, and Grafana. Covers netdata tutorial, netdata setup, real time monitoring, netdata vs prometheus, and netdata performance tuning.’ tags: [‘devops’, ‘guide’, ‘monitoring’, ‘observability’, ‘open-source’, ‘reference’, ’tutorial’] date: 2026-05-19 00:00:00+08:00 lastmod: 2026-05-19 00:00:00+08:00 tech_stack: [] application_domain: Dev Utils source_version: ’’ licensing_model: Open Source license_type: GPL-3.0 file_size: ’’ file_md5: ’’ download_url: ’’ backup_url: ’’ github_repo: ‘https://github.com/netdata/netdata' last_maintained: ‘2026-05-19’ draft: false categories: [‘dev-utils’] aliases:
- /posts/netdata/
faqs:
- q: ‘How much RAM and CPU does Netdata use per node?’ a: ‘In its default configuration Netdata uses under 5% CPU and roughly 100-150 MB RAM per node. A child node streaming to a parent in RAM mode uses about 50 MB, while a parent storing 7 days of 1-second data for 10 nodes needs 2.5-3.5 GB RAM with a 1.4 GB page cache.’
- q: ‘Can Netdata run without Netdata Cloud?’ a: ‘Yes. The open-source agent is fully functional with no cloud connection. You access dashboards directly on any agent at port 19999 and use parent-child streaming for centralized aggregation. Netdata Cloud only adds unified multi-host dashboards, mobile apps, and advanced alert routing.’
- q: ‘How do I install Netdata with one command on Linux?’ a: ‘Run curl -Ss https://get.netdata.cloud/kickstart.sh | sudo bash, which installs Netdata with all defaults in under 60 seconds. Verify it with sudo systemctl status netdata and open the dashboard at http://localhost:19999.’
- q: ‘How does Netdata compare to Prometheus for monitoring?’ a: ‘Netdata collects metrics at 1-second granularity with zero configuration and a built-in real-time dashboard, while Prometheus polls every 15-60 seconds and requires PromQL with external visualization like Grafana. Many teams run both, using Netdata for per-node real-time troubleshooting and Prometheus for cluster-level aggregation; Netdata can export metrics to Prometheus via OpenMetrics format.’
- q: ‘Does Netdata support custom application metrics?’ a: ‘Yes. You can send custom metrics through the built-in StatsD server on port 8125, expose them via the OpenMetrics endpoint, or write a custom collector in Python or Go using the go.d.plugin framework.’
{{< resource-info >}}
Introduction #
Most monitoring tools show you what happened 30 seconds ago. By then, the microburst that killed your database connection pool is already gone — leaving only a cryptic log entry and an angry pager. Netdata closes that gap with per-second metrics, sub-2-second visualization latency, and a single binary that installs in under 60 seconds. With 78,874 GitHub stars and a GPL-3.0 license, it is one of the most popular open-source monitoring agents in production today. This guide walks through a complete Netdata setup — from a single-node Docker deployment to a streaming Kubernetes cluster — with real performance-tuning configurations you can apply immediately.
What Is Netdata? #
Netdata is a distributed real-time monitoring agent that collects, stores, and visualizes system and application metrics with per-second granularity. Unlike traditional polling-based systems that sample every 15–60 seconds, Netdata runs directly on each node, capturing thousands of metrics locally and streaming them to central parents when needed. Written in C (54.2%), Go (29%), and Rust (8.5%), it is designed for minimal resource overhead: under 5% CPU and ~150 MB RAM per node in default configuration.
How Netdata Works #
Netdata’s architecture follows an edge-first, distributed model. Each node runs an independent agent that auto-discovers 800+ integrations without configuration files.


Core components:
- Data Collection Layer: Built-in collectors for CPU, memory, disk, network, containers, databases, and applications. No external dependencies like Telegraf or Exporters required.
- Database Engine (dbengine): A custom high-performance time-series store using ~0.5 bytes per sample with tiered storage for long-term retention.
- ML Anomaly Detection: 18 unsupervised ML models per metric run at the edge, achieving consensus-based anomaly detection with 99% false-positive reduction.
- Streaming & Parent-Child: Any agent can act as a “parent” to aggregate metrics from child nodes, enabling horizontal scaling without central bottlenecks.
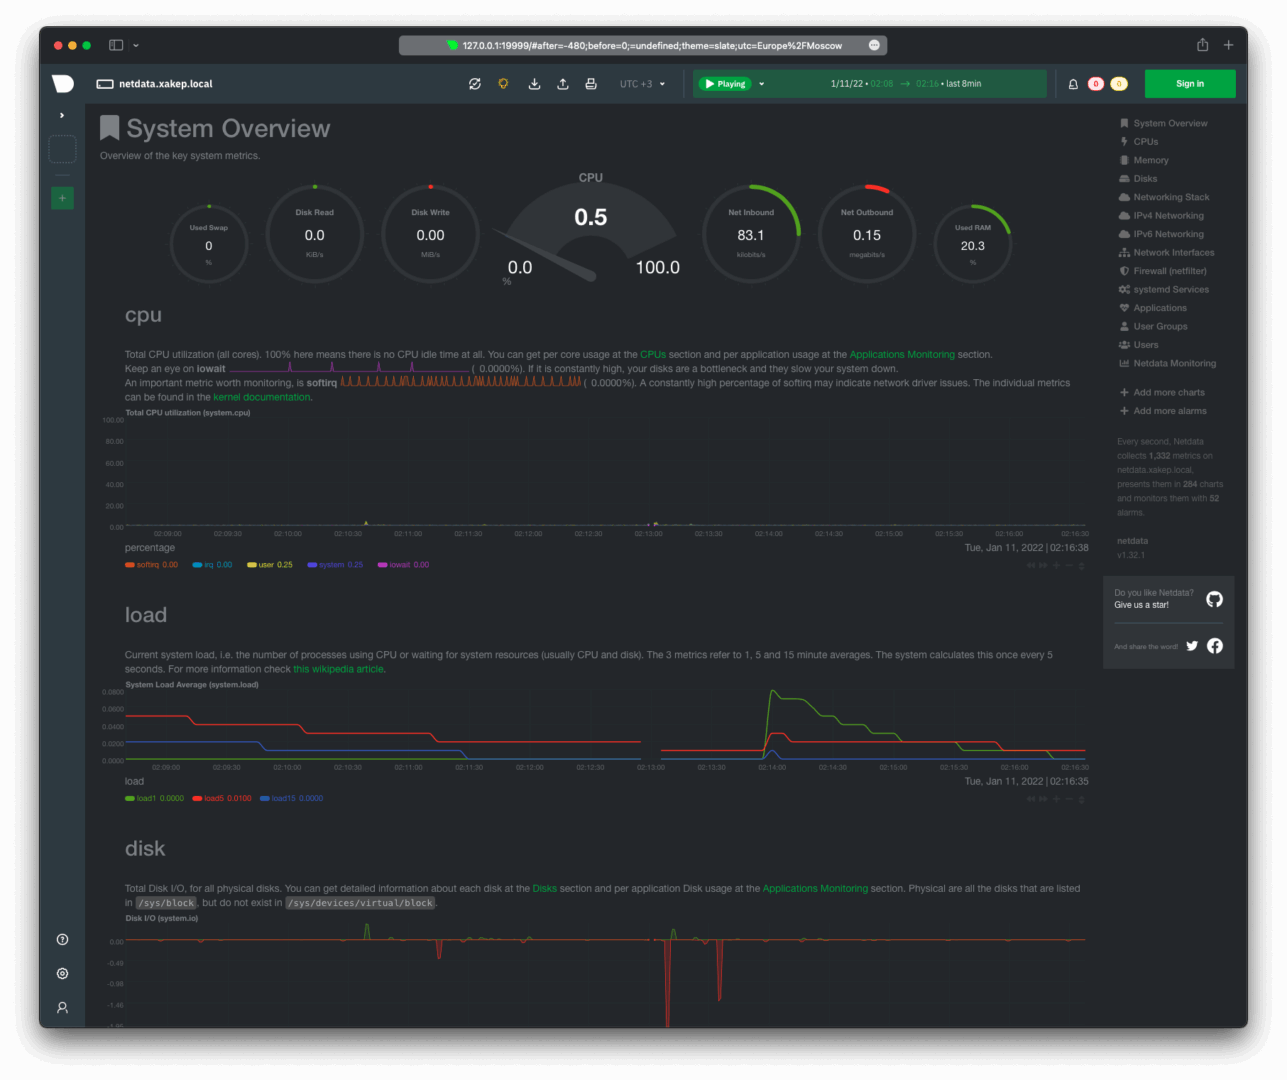
- Web Dashboard: Embedded static-threaded web server serves real-time charts directly from the agent on port 19999.
Installation & Setup #
One-Line Install (Linux) #
The fastest way to get Netdata running:
a
s
h
# Install Netdata with all defaultscurl -Ss https://get.netdata.cloud/kickstart.sh | sudo bash
Verify the installation:
a
s
h
sudo systemctl status netdata
# Active: active (running) since ...
Access the local dashboard at http://localhost:19999.
Docker Deploy #
For containerized environments:
a
s
h
docker run -d --name=netdata \
  -p 19999:19999 \
  -v /proc:/host/proc:ro \
  -v /sys:/host/sys:ro \
  -v /var/run/docker.sock:/var/run/docker.sock:ro \
  --cap-add SYS_PTRACE \
  --security-opt apparmor=unconfined \
  netdata/netdata:latest
Docker Compose (Production-Ready) #
a
m
l
version: '3.8'
services:
  netdata:
    image: netdata/netdata:v2.5.0
    container_name: netdata
    hostname: "netdata-${HOSTNAME}"
    ports:
      - "19999:19999"
    restart: unless-stopped
    cap_add:
      - SYS_PTRACE
      - SYS_ADMIN
    security_opt:
      - apparmor:unconfined
    volumes:
      - /proc:/host/proc:ro
      - /sys:/host/sys:ro
      - /etc/os-release:/host/etc/os-release:ro
      - /var/run/docker.sock:/var/run/docker.sock:ro
      - netdata-config:/etc/netdata
      - netdata-lib:/var/lib/netdata
      - netdata-cache:/var/cache/netdata
    environment:
      - NETDATA_CLAIM_TOKEN=${NETDATA_CLAIM_TOKEN}
      - NETDATA_CLAIM_URL=https://app.netdata.cloud
      - NETDATA_CLAIM_ROOMS=${NETDATA_CLAIM_ROOMS}
volumes:
  netdata-config:
  netdata-lib:
  netdata-cache:
Kubernetes Helm Install #
a
s
h
# Add the Netdata Helm repository
helm repo add netdata https://netdata.github.io/helmchart/
helm repo update

# Install with default values
helm install netdata netdata/netdata \
  --namespace monitoring \
  --create-namespace
Verify the pods:
a
s
h
kubectl get pods -n monitoring
# NAME                    READY   STATUS
# netdata-parent-0        1/1     Running
# netdata-child-xxx       1/1     Running
Generate Current Config #
Download the running configuration to customize:
a
s
h
# Download current effective config
curl -o /etc/netdata/netdata.conf http://localhost:19999/netdata.conf
# Or use the edit-config script
sudo /etc/netdata/edit-config netdata.conf
Integration with Popular Tools #
Prometheus Remote Write #
Export Netdata metrics to Prometheus for long-term storage and PromQL queries:
a
s
h
sudo /etc/netdata/edit-config exporting.conf
o
n
f
[prometheus:remote_write]
    enabled = yes
    destination = prometheus:9090
    remote write URL path = /api/v1/write
    data source = average
    prefix = netdata
    send charts matching = *
    send hosts matching = *
Restart Netdata:
a
s
h
sudo systemctl restart netdata
Grafana Dashboard #
While Netdata has a built-in dashboard, many teams prefer Grafana for centralized visualization. Add Netdata as a Prometheus data source in Grafana:
a
m
l
# datasource.yaml in Grafana
apiVersion: 1
datasources:
  - name: Netdata-Prometheus
    type: prometheus
    url: http://netdata:19999/api/v1/allmetrics?format=prometheus
    access: proxy
    isDefault: false
    jsonData:
      timeInterval: "1s"
Kubernetes DaemonSet (Advanced) #
For full host-level visibility on every K8s node:
a
m
l
apiVersion: apps/v1
kind: DaemonSet
metadata:
  name: netdata
  namespace: monitoring
spec:
  selector:
    matchLabels:
      app: netdata
  template:
    metadata:
      labels:
        app: netdata
    spec:
      hostNetwork: true
      hostPID: true
      containers:
        - name: netdata
          image: netdata/netdata:v2.5.0
          ports:
            - containerPort: 19999
              hostPort: 19999
          securityContext:
            capabilities:
              add: [SYS_PTRACE, SYS_ADMIN]
          volumeMounts:
            - name: proc
              mountPath: /host/proc
              readOnly: true
            - name: sys
              mountPath: /host/sys
              readOnly: true
            - name: docker-sock
              mountPath: /var/run/docker.sock
              readOnly: true
      volumes:
        - name: proc
          hostPath:
            path: /proc
        - name: sys
          hostPath:
            path: /sys
        - name: docker-sock
          hostPath:
            path: /var/run/docker.sock
PostgreSQL Monitoring #
Enable the PostgreSQL collector in go.d/postgres.conf:
a
m
l
jobs:
  - name: local
    dsn: 'postgres://netdata_monitor:password@localhost:5432/postgres'
    collect:
      - database_statistics
      - table_statistics
      - index_statistics
      - replication_statistics
    timeout: 2
Test the collector:
a
s
h
sudo /etc/netdata/edit-config go.d/postgres.conf
# Restart to apply
sudo systemctl restart netdata
Nginx Monitoring #
Monitor Nginx stub_status and access logs:
a
m
l
# /etc/netdata/go.d/nginx.conf
jobs:
  - name: local
    url: http://localhost/stub_status

  - name: access_log
    path: /var/log/nginx/access.log
    parser:
      type: ltsv
Benchmarks / Real-World Use Cases #
Resource Footprint Comparison #
The University of Amsterdam published a peer-reviewed study (ICSOC 2023) ranking Netdata as the most energy-efficient monitoring tool for Docker-based systems. Independent benchmarks confirm:
| Scenario | Netdata | Prometheus + Node Exporter | Zabbix Agent |
|---|---|---|---|
| CPU Overhead (%) | 1–5% | 5–15% | 10–20% |
| RAM per Node | 100–150 MB | 200–500 MB | 150–300 MB |
| Collection Interval | 1 second | 15–60 seconds | 30–60 seconds |
| Startup Time | < 60 seconds | 30–60 minutes | 2–4 hours |
| Metrics per Node | 2,000+ | 500–1,000 | 1,000–2,000 |
| Config Required | Zero | Moderate | Extensive |
Streaming Scale Benchmarks #
Netdata’s parent-child streaming architecture scales horizontally:
- Single Parent: 1 million+ samples/second ingestion, ~3.5 GB RAM
- 10 Child Nodes: 20k metrics each, 1-second retention for 7 days, 12 GB disk
- Active-Active Cluster: Unlimited horizontal scaling with full data replication
- Ephemeral Nodes: Stream metrics to parents, retain data after node termination
Real-World Deployment: 500-Node K8s Cluster #
A mid-size SaaS company running 500 Kubernetes nodes uses:
- 5 Netdata parents (active-active) across 3 availability zones
- 500 child agents via DaemonSet, each running in RAM mode (~50 MB)
- Tiered storage: 1-second for 7 days, 1-minute for 1 month, 1-hour for 1 year
- Total parent storage: 25 GB per parent (125 GB cluster-wide)
- Alert routing via Netdata Cloud to PagerDuty and Slack
Advanced Usage / Production Hardening #
Performance Tuning: netdata.conf #
The default configuration is optimized for standalone use. For production systems, tune the database engine and disable unnecessary collectors.
Minimal footprint (production child nodes):
o
n
f
[global]
    # Run with lowest priority to avoid impacting applications
    process scheduling policy = batch
    process nice level = 19
    # Reduce threads on constrained nodes
    libuv worker threads = 4

[db]
    # Use RAM-only mode for child nodes streaming to parents
    mode = ram
    retention = 3600
    # Single tier is sufficient for local buffering
    storage tiers = 1

[ml]
    # Disable ML on child nodes — run on parents
    enabled = no

[health]
    # Disable local alerting on child nodes
    enabled = no

[web]
    # Bind only to localhost for security
    bind to = 127.0.0.1
    allow connections from = localhost

[plugins]
    # Disable unused collectors to reduce CPU/RAM
    ebpf = no
    perf = no
    nfacct = no
    fping = no
    ioping = no
    tc = no
    idlejitter = no
    debugfs = no
    systemd-journal = no
Parent node with tiered storage (central monitoring):
o
n
f
[db]
    mode = dbengine
    storage tiers = 3
    dbengine page cache size = 1.4GiB

    # Tier 0: 1-second resolution, 7 days
    update every = 1
    dbengine tier 0 retention size = 12GiB
    dbengine tier 0 retention time = 7d

    # Tier 1: 1-minute resolution, 1 month
    dbengine tier 1 update every iterations = 60
    dbengine tier 1 retention size = 4GiB
    dbengine tier 1 retention time = 1mo

    # Tier 2: 1-hour resolution, 1 year
    dbengine tier 2 update every iterations = 60
    dbengine tier 2 retention size = 2GiB
    dbengine tier 2 retention time = 1y

[ml]
    enabled = yes
    # 18 ML models per metric, trains every 3 hours
    train every = 10800
    number of models per dimension = 18

[health]
    enabled = yes
    # Run health checks every 10 seconds
    run at least every seconds = 10

[web]
    # Expose to network for dashboard access
    bind to = *
    # Restrict access to internal networks
    allow connections from = 10.* 192.168.* 172.16.* 172.17.*
Streaming Configuration: stream.conf #
On child nodes (/etc/netdata/stream.conf):
o
n
f
[stream]
    enabled = yes
    destination = tcp:netdata-parent.monitoring.svc.cluster.local:19999
    api key = YOUR_API_KEY_HERE
    timeout seconds = 60
    default port = 19999
    send charts matching = *
    buffer size bytes = 1048576
    reconnect delay seconds = 5
    initial clock resync iterations = 60
On the parent (/etc/netdata/stream.conf):
o
n
f
[API_KEY]
    enabled = yes
    default memory mode = dbengine
    health enabled by default = yes
Security Hardening #
Enable TLS for the web interface:
o
n
f
[web]
    tls version = 1.3
    ssl key = /etc/netdata/ssl/key.pem
    ssl certificate = /etc/netdata/ssl/cert.pem
    # Require TLS for all connections
    bind to = *=dashboard|registry|badges|management|streaming|netdata.conf|readable|writable
Monitoring Netdata Itself #
Track the agent’s own resource usage:
a
s
h
# View internal metrics
curl -s http://localhost:19999/api/v1/info | jq '.version, .hog'

# Check dbengine statistics
curl -s http://localhost:19999/api/v1/data?chart=netdata.dbengine_main_page_stats
Comparison with Alternatives #
| Feature | Netdata | Prometheus | Datadog | Zabbix |
|---|---|---|---|---|
| Collection Interval | 1 second | 15–60 seconds | 15 seconds | 30–60 seconds |
| Agent RAM | 100–150 MB | 200–500 MB | 200–400 MB | 150–300 MB |
| Agent CPU | 1–5% | 5–15% | 3–8% | 10–20% |
| Setup Time | < 60 seconds | 30–60 min | 10–20 min | 2–4 hours |
| Auto-Discovery | 800+ integrations | Limited | 600+ integrations | Template-based |
| Built-in Dashboard | Yes (real-time) | No (PromQL only) | Yes | Yes (dated) |
| ML Anomaly Detection | 18 models/metric | No (requires extra) | Yes | Limited |
| Long-Term Storage | Tiered dbengine | 15 days default | Cloud | External DB |
| Licensing | GPL-3.0 (free) | Apache-2.0 (free) | $15/host/month | GPL-2.0 (free) |
| Alert Routing | Built-in + Cloud | Alertmanager | Built-in | Built-in |
| Kubernetes Native | Yes (Helm chart) | Yes (operator) | Yes (operator) | Limited |
When to choose what:
- Netdata: Single-node visibility, real-time troubleshooting, resource-constrained environments, teams that need zero-config monitoring.
- Prometheus: Cloud-native metric aggregation, complex PromQL queries, long-term storage with Thanos/VictoriaMetrics.
- Datadog: Enterprise-wide observability (metrics + logs + traces + APM), managed SaaS with SOC 2 compliance.
- Zabbix: Mixed infrastructure (network gear + servers + SNMP), organizations needing agent + agentless monitoring.
Limitations / Honest Assessment #
Netdata is not the right tool for every monitoring scenario:
- No centralized multi-host view without Netdata Cloud: The open-source agent dashboards are per-node. For a unified view across 100+ nodes, you either need Netdata Cloud (SaaS) or a parent streaming setup with external visualization.
- Limited long-term storage in default config: The dbengine defaults to ~256 MB disk per tier. For years of retention at scale, you need explicit tiered storage configuration or an external TSDB like VictoriaMetrics.
- Alerting pipeline less flexible than Alertmanager: While Netdata has built-in health checks and notifications, complex routing trees, silencing, and on-call rotation require Netdata Cloud or integration with PagerDuty/OpsGenie.
- Not a full observability platform: Netdata focuses on metrics. For distributed tracing, structured logging, and APM, pair it with Jaeger, Loki, or OpenTelemetry.
- Windows support is newer: The Windows agent is functional but has fewer collectors than Linux. For Windows-centric environments, verify collector coverage before deploying.
Frequently Asked Questions #
Q: How much RAM does Netdata actually use in production?
On a child node streaming to a parent, ~50 MB with the RAM-mode configuration shown above. On a parent storing 7 days of 1-second data for 10 nodes, expect 2.5–3.5 GB RAM with a 1.4 GB page cache. The agent auto-tunes cache sizes based on available system memory.
Q: Can I run Netdata without Netdata Cloud?
Yes. The open-source agent is fully functional without any cloud connection. Use parent-child streaming for centralized aggregation and access dashboards directly on any agent at port 19999. Netdata Cloud adds unified dashboards, mobile apps, and advanced alert routing but is not required.
Q: How does Netdata compare to Prometheus + Grafana?
Netdata excels at real-time, per-node visibility with zero configuration. Prometheus excels at metric aggregation across dynamic, ephemeral fleets with PromQL. Many teams run both: Netdata on every node for real-time troubleshooting, Prometheus for cluster-level aggregation and long-term trending. Netdata can export metrics to Prometheus via OpenMetrics format.
Q: What is the maximum scale Netdata can handle?
A single parent node can ingest 1+ million samples/second. For horizontal scaling, deploy active-active parent clusters. There is no theoretical limit — the architecture is distributed by design. The Netdata Cloud SaaS handles millions of nodes.
Q: How do I back up Netdata’s database and configuration?
Configuration lives in /etc/netdata/ and can be version-controlled (Git, Ansible, Puppet). The dbengine database in /var/cache/netdata/ is self-healing and does not require manual backup — streaming to multiple parent nodes provides natural redundancy. For critical environments, run active-active parent pairs.
Q: Does Netdata support custom application metrics?
Yes. Use the built-in StatsD server (port 8125), the OpenMetrics endpoint, or write a custom collector in Python or Go. The go.d.plugin framework supports building new collectors with minimal boilerplate.
Conclusion #
Netdata delivers on a promise most monitoring tools fail to keep: immediate, per-second visibility with negligible resource overhead. For teams running Docker, Kubernetes, or bare-metal infrastructure, it is the fastest path from “nothing” to “monitoring everything.” The streaming architecture scales from a single Raspberry Pi to a multi-region Kubernetes cluster, and the GPL-3.0 license means zero licensing costs.
Action items:
- Run the one-line installer on your most critical server today
- Deploy the Helm chart on your Kubernetes cluster
- Configure parent-child streaming for production hardening
- Tune
netdata.conffor your resource constraints using the configs above
Join the Netdata community on Telegram for real-time support and discussions with 5,000+ engineers.
Affiliate disclosure: This article contains affiliate links for DigitalOcean and HTStack. If you purchase hosting services through these links, dibi8.com may receive a commission at no additional cost to you.
Recommended Hosting & Infrastructure #
Before you deploy any of the tools above into production, you’ll need solid infrastructure. Two options dibi8 actually uses and recommends:
- DigitalOcean — $200 free credit for 60 days across 14+ global regions. The default option for indie devs running open-source AI tools.
- HTStack — Hong Kong VPS with low-latency access from mainland China. This is the same IDC that hosts dibi8.com — battle-tested in production.
Affiliate links — they don’t cost you extra and they help keep dibi8.com running.
Sources & Further Reading #
- Netdata GitHub Repository — 78,874 stars, GPL-3.0
- Official Documentation
- Netdata Helm Chart Reference
- Deployment Strategies & Parent-Child Streaming
- RAM Requirements & Sizing Guide
- Long-Term Data Retention Configuration
- Scaling Without Limits — Horizontal Architecture
- University of Amsterdam Energy Efficiency Study
- Netdata vs Zabbix Official Comparison
- Release Notes & Changelog
💬 Bình luận & Thảo luận