Prometheus: 64,094 GitHub Stars
Prometheus (Prom) là hệ thống giám sát và cơ sở dữ liệu chuỗi thờ gian mã nguồn mở. Tương thích với Docker, Kubernetes, Grafana và Alertmanager. Bao gồm hướng dẫn cài đặt, truy vấn PromQL, cung cố hóa sản xuất và điểm chuẩn hiệu suất.
- Apache-2.0
- Cập nhật 2026-05-19
lang: vi slug: prometheus title: ‘Prometheus: 64,094 GitHub Stars — Docker Deployment Guide 2026’ description: ‘Prometheus (Prom) is an open-source monitoring system and time series database. Compatible with Docker, Kubernetes, Grafana, and Alertmanager. Covers installation, PromQL queries, production hardening, and performance benchmarks.’ tags: [‘automation’, ‘ci-cd’, ‘container’, ‘devops’, ‘docker’, ‘github’, ‘guide’, ‘open-source’, ‘reference’, ’tutorial’] date: 2026-05-19 00:00:00+08:00 lastmod: 2026-05-19 00:00:00+08:00 tech_stack: [] application_domain: Dev Utils source_version: ’’ licensing_model: Open Source license_type: Apache-2.0 file_size: ’’ file_md5: ’’ download_url: ’’ backup_url: ’’ github_repo: ‘https://github.com/prometheus/prometheus' last_maintained: ‘2026-05-19’ draft: false categories: [‘dev-utils’] aliases:
- /posts/prometheus/
faqs:
- q: ‘Why does Prometheus use a pull-based architecture instead of push?’
a: ‘Prometheus scrapes HTTP /metrics endpoints on a configured interval rather than having applications push to a collector. This simplifies service discovery, removes the need for agents on every host, and provides built-in health detection: if a target stops responding, the
upmetric immediately reports 0.’ - q: ‘How many samples per second can a single Prometheus node handle?’ a: ‘A single Prometheus server handles roughly 100,000 to 300,000 samples per second depending on hardware, typically using 4 CPU cores and 2 to 4 GB of memory. Beyond that you need federation or remote-write to solutions like Thanos, Cortex, or VictoriaMetrics.’
- q: ‘What is the default data retention period in Prometheus and how do I change it?’
a: ‘Local storage retention defaults to 15 days and is configurable with the
--storage.tsdb.retention.timeflag (for example30d). For multi-year retention you must use remote write to Thanos, Mimir, or external object storage, since practical local limits depend on disk size.’ - q: ‘Can Prometheus run in high availability mode?’ a: ‘Prometheus does not cluster natively. For high availability you run two identical Prometheus instances scraping the same targets, then use Thanos Querier or Cortex for deduplication and global querying.’
- q: ‘How do I monitor a Python application with Prometheus?’ a: ‘Use the official prometheus-client Python library to expose a /metrics endpoint on your application, then configure Prometheus to scrape it. For Flask apps use prometheus_flask_exporter, and for Django use django-prometheus.’
- q: ‘Why does Prometheus use a pull-based architecture instead of push?’
a: ‘Prometheus scrapes HTTP /metrics endpoints on a configured interval rather than having applications push to a collector. This simplifies service discovery, removes the need for agents on every host, and provides built-in health detection: if a target stops responding, the
{{< resource-info >}}
Puppeteer: 94,300 GitHub Stars • LazyDocker: 51,092 GitHub Stars
Introduction #
Your application is down. Again. The page loads slowly, customers are complaining, and your team has no visibility into whether the database is choking or the API layer is failing. This is the monitoring gap that kills production confidence. Enter Prometheus — the Cloud Native Computing Foundation’s second-ever graduated project (after Kubernetes), with 64,094 GitHub stars and a battle-tested track record at companies like DigitalOcean, Uber, and SoundCloud. This Prometheus tutorial walks through a production-grade monitoring setup with Docker and Kubernetes, real PromQL queries, and hard numbers you can use to justify the tooling choice to your team. Whether you are comparing Prometheus vs Datadog for cost reasons or need a complete Prometheus Docker deployment guide, this article has you covered.
What Is Prometheus? #
Prometheus is an open-source monitoring system and time series database designed for cloud-native environments. Originally built at SoundCloud in 2012 and inspired by Google’s Borgmon, it has become the de facto standard for metrics collection in containerized and microservices architectures. The project graduated from the CNCF in 2016 and continues to ship major releases — the latest stable version is v3.11.0 (April 2026), with v3.12.0-rc.0 in pre-release.

How Prometheus Works #
Prometheus uses a pull-based architecture. Instead of applications pushing metrics to a central collector, Prometheus scrapes HTTP endpoints on a configured interval. This design simplifies service discovery, eliminates the need for agents on every host, and provides built-in health detection — if a target does not respond, the up metric immediately reports 0.
The core components are:
| Component | Role |
|---|---|
| Prometheus Server | Scrapes metrics, stores them in TSDB, evaluates rules |
| TSDB | Custom time-series database with Head (in-memory) and Block (on-disk) layers |
| Service Discovery | Automatically finds targets via Kubernetes API, AWS EC2, Consul, DNS |
| Alertmanager | Deduplicates, groups, and routes alerts to Slack, PagerDuty, email |
| Exporters | Sidecar utilities that expose metrics for third-party systems |
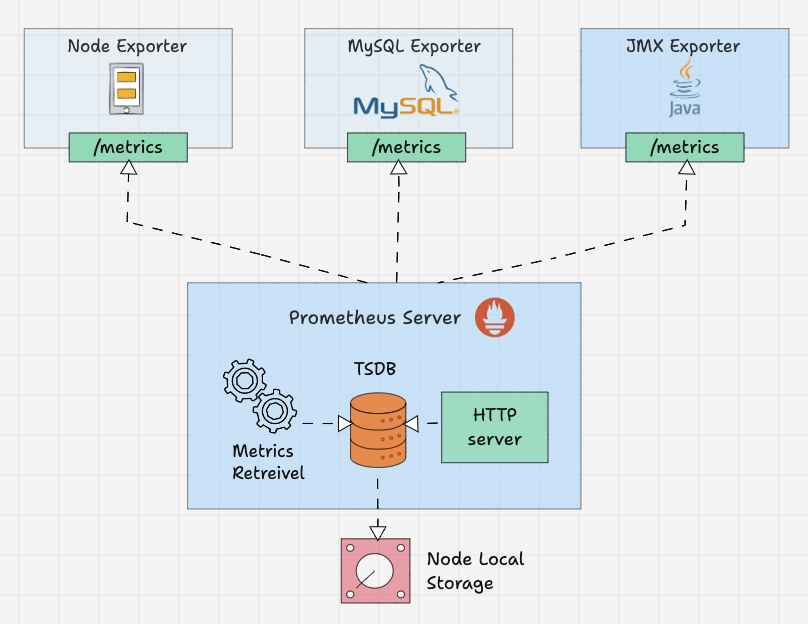
Data flows as follows: Service Discovery identifies targets, the Scraper pulls metrics via HTTP, TSDB stores samples with compression, and the Rule Engine evaluates alerting and recording rules. The Alertmanager handles notification routing, while the HTTP API serves queries to Grafana or the built-in expression browser.
Key design decisions:
- Pull over push: Targets only need to expose
/metrics; no agent configuration required - Local storage: Each Prometheus server is autonomous by default
- Dimensional data model: Every metric carries key-value labels enabling flexible queries
- PromQL: A powerful query language for aggregation, rate calculation, and alerting
Installation & Setup #
Docker Setup (Single Node, < 5 Minutes) #
The fastest path to a running Prometheus instance is Docker. Create a project directory and two files:
prometheus.yml:
a
m
l
global:
  scrape_interval: 15s
  evaluation_interval: 15s

scrape_configs:
  - job_name: 'prometheus'
    static_configs:
      - targets: ['localhost:9090']
docker-compose.yml:
a
m
l
version: '3.8'

services:
  prometheus:
    image: prom/prometheus:v3.11.0
    container_name: prometheus
    ports:
      - "9090:9090"
    volumes:
      - prometheus-data:/prometheus
      - ./prometheus.yml:/etc/prometheus/prometheus.yml:ro
    command:
      - '--config.file=/etc/prometheus/prometheus.yml'
      - '--storage.tsdb.path=/prometheus'
      - '--storage.tsdb.retention.time=30d'
      - '--web.enable-lifecycle'
    restart: unless-stopped

volumes:
  prometheus-data:
Start the stack:
a
s
h
docker compose up -d
Access the UI at http://localhost:9090. The --web.enable-lifecycle flag enables configuration reload via POST /-/reload without restarting the container.
Docker Full Stack: Prometheus + Grafana + Node Exporter + cAdvisor #
For a complete monitoring stack, add Grafana for visualization and exporters for host/container metrics:
a
m
l
version: '3.8'

services:
  prometheus:
    image: prom/prometheus:v3.11.0
    volumes:
      - ./prometheus.yml:/etc/prometheus/prometheus.yml:ro
      - prometheus-data:/prometheus
    ports:
      - "9090:9090"
    command:
      - '--config.file=/etc/prometheus/prometheus.yml'
      - '--storage.tsdb.path=/prometheus'
      - '--storage.tsdb.retention.time=30d'
      - '--web.enable-lifecycle'
    restart: unless-stopped

  grafana:
    image: grafana/grafana:11.0.0
    ports:
      - "3000:3000"
    volumes:
      - grafana-data:/var/lib/grafana
    environment:
      - GF_SECURITY_ADMIN_PASSWORD=admin
    depends_on:
      - prometheus
    restart: unless-stopped

  node-exporter:
    image: prom/node-exporter:v1.9.0
    volumes:
      - /proc:/host/proc:ro
      - /sys:/host/sys:ro
      - /:/rootfs:ro
    command:
      - '--path.procfs=/host/proc'
      - '--path.rootfs=/rootfs'
      - '--path.sysfs=/host/sys'
      - '--collector.filesystem.mount-points-exclude=^/(sys|proc|dev|host|etc)($$|/)'
    restart: unless-stopped

  cadvisor:
    image: gcr.io/cadvisor/cadvisor:v0.49.1
    volumes:
      - /:/rootfs:ro
      - /var/run:/var/run:ro
      - /sys:/sys:ro
      - /var/lib/docker/:/var/lib/docker:ro
      - /dev/disk/:/dev/disk:ro
    ports:
      - "8080:8080"
    restart: unless-stopped

volumes:
  prometheus-data:
  grafana-data:
Updated prometheus.yml for full stack:
a
m
l
global:
  scrape_interval: 15s
  evaluation_interval: 15s

scrape_configs:
  - job_name: 'prometheus'
    static_configs:
      - targets: ['prometheus:9090']

  - job_name: 'node-exporter'
    static_configs:
      - targets: ['node-exporter:9100']

  - job_name: 'cadvisor'
    static_configs:
      - targets: ['cadvisor:8080']
Kubernetes Deployment with Helm #
For production Kubernetes environments, use the kube-prometheus-stack Helm chart. This is the standard approach for Prometheus Kubernetes deployments:
a
s
h
helm repo add prometheus-community https://prometheus-community.github.io/helm-charts
helm repo update

# Create monitoring namespace
kubectl create namespace monitoring

# Install the stack
helm install prometheus prometheus-community/kube-prometheus-stack \
  --namespace monitoring \
  --set prometheus.prometheusSpec.retention=30d \
  --set prometheus.prometheusSpec.storageSpec.volumeClaimTemplate.spec.resources.requests.storage=50Gi \
  --set grafana.enabled=true \
  --set grafana.adminPassword='your-secure-password'
Verify the deployment:
a
s
h
kubectl get pods -n monitoring
Port-forward to access services locally:
a
s
h
# Prometheus UI
kubectl port-forward svc/prometheus-kube-prometheus-prometheus 9090:9090 -n monitoring

# Grafana (default credentials: admin / the password you set)
kubectl port-forward svc/prometheus-grafana 3000:80 -n monitoring

# Alertmanager
kubectl port-forward svc/prometheus-kube-prometheus-alertmanager 9093:9093 -n monitoring
Production Values for Kubernetes #
a
m
l
# values-production.yaml
prometheus:
  prometheusSpec:
    resources:
      requests:
        memory: 2Gi
        cpu: 500m
      limits:
        memory: 4Gi
        cpu: 2000m
    storageSpec:
      volumeClaimTemplate:
        spec:
          storageClassName: gp3
          accessModes: ["ReadWriteOnce"]
          resources:
            requests:
              storage: 100Gi
    retention: "30d"
    retentionSize: "90GB"
    scrapeInterval: "30s"
    enableAdminAPI: false

alertmanager:
  alertmanagerSpec:
    resources:
      requests:
        memory: 256Mi
        cpu: 100m
      limits:
        memory: 512Mi
        cpu: 500m

grafana:
  enabled: true
  persistence:
    enabled: true
    size: 10Gi
Apply with:
a
s
h
helm upgrade --install prometheus prometheus-community/kube-prometheus-stack \
  -n monitoring -f values-production.yaml
Integration with Docker, Kubernetes, Grafana, and Alertmanager #
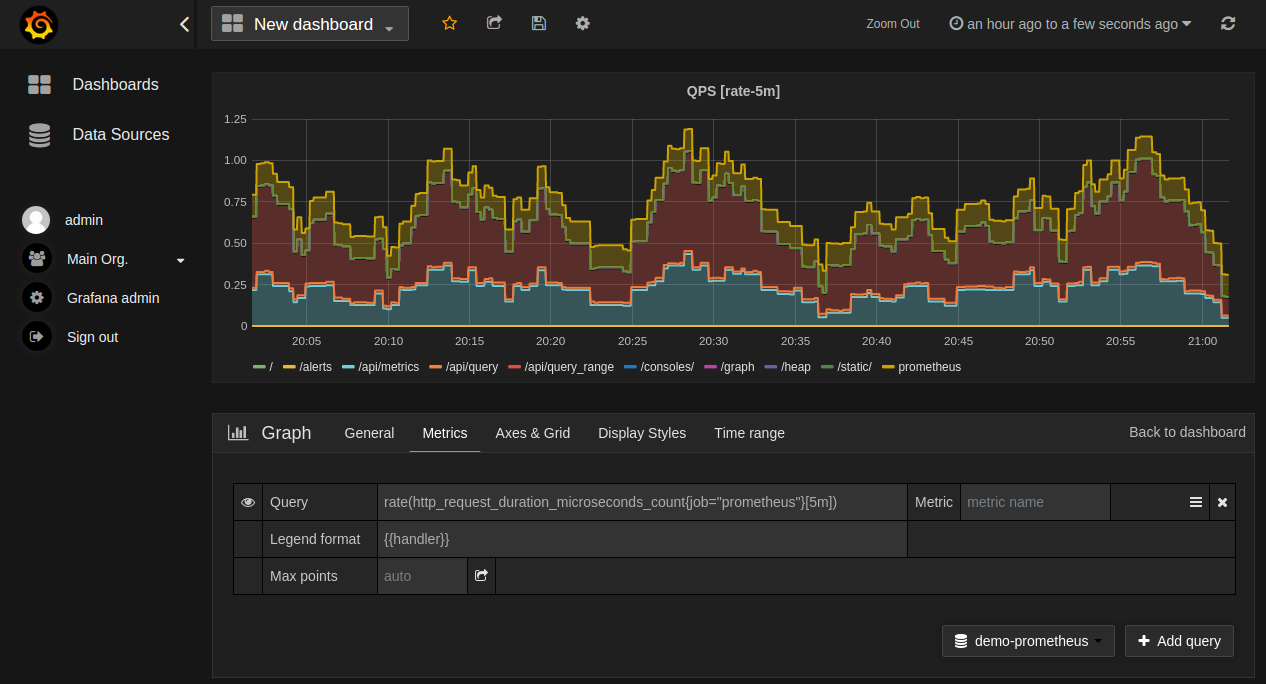
Prometheus + Grafana Dashboard #
Grafana connects to Prometheus as a data source. After launching the stack, add Prometheus:
- Navigate to Grafana → Configuration → Data Sources → Add Data Source
- Select Prometheus
- URL:
http://prometheus:9090(Docker) orhttp://prometheus-kube-prometheus-prometheus.monitoring.svc.cluster.local:9090(Kubernetes) - Click Save & Test
Import dashboard ID 1860 (Node Exporter Full) for a complete host metrics dashboard, or dashboard ID 14282 for cAdvisor container metrics.
Prometheus + Alertmanager Alerting Rules #
Create alert-rules.yml:
a
m
l
groups:
  - name: node-alerts
    rules:
      - alert: HighMemoryUsage
        expr: (node_memory_MemTotal_bytes - node_memory_MemAvailable_bytes) / node_memory_MemTotal_bytes * 100 > 85
        for: 5m
        labels:
          severity: warning
        annotations:
          summary: "High memory usage on {{ $labels.instance }}"
          description: "Memory usage is above 85% (current value: {{ $value }}%)"

      - alert: HighCPUUsage
        expr: 100 - (avg by(instance) (irate(node_cpu_seconds_total{mode="idle"}[5m])) * 100) > 80
        for: 5m
        labels:
          severity: critical
        annotations:
          summary: "High CPU usage on {{ $labels.instance }}"
          description: "CPU usage is above 80% (current value: {{ $value }}%)"

      - alert: DiskSpaceLow
        expr: (node_filesystem_avail_bytes / node_filesystem_size_bytes) * 100 < 10
        for: 5m
        labels:
          severity: warning
        annotations:
          summary: "Low disk space on {{ $labels.instance }}"
          description: "Disk space is below 10% (mountpoint: {{ $labels.mountpoint }})"

      - alert: InstanceDown
        expr: up == 0
        for: 3m
        labels:
          severity: critical
        annotations:
          summary: "Instance {{ $labels.instance }} is down"
          description: "Target has been unreachable for more than 3 minutes"

      - alert: HighRequestLatency
        expr: histogram_quantile(0.95, rate(http_request_duration_seconds_bucket[5m])) > 0.5
        for: 5m
        labels:
          severity: warning
        annotations:
          summary: "High request latency on {{ $labels.instance }}"
          description: "95th percentile latency is {{ $value }}s"
Reference the rules in prometheus.yml:
a
m
l
rule_files:
  - '/etc/prometheus/alert-rules.yml'

alerting:
  alertmanagers:
    - static_configs:
        - targets: ['alertmanager:9093']
Alertmanager Configuration for Slack #
Create alertmanager.yml:
a
m
l
global:
  slack_api_url: 'YOUR_SLACK_WEBHOOK_URL'

route:
  receiver: 'slack-notifications'
  group_by: ['alertname', 'severity']
  group_wait: 30s
  group_interval: 5m
  repeat_interval: 4h

receivers:
  - name: 'slack-notifications'
    slack_configs:
      - channel: '#alerts'
        send_resolved: true
        title: '{{ range .Alerts }}{{ .Annotations.summary }}{{ end }}'
        text: '{{ range .Alerts }}{{ .Annotations.description }}{{ end }}'
Prometheus + Kubernetes Service Discovery #
Prometheus discovers Kubernetes targets automatically:
a
m
l
scrape_configs:
  - job_name: 'kubernetes-pods'
    kubernetes_sd_configs:
      - role: pod
        namespaces:
          names:
            - default
            - production
    relabel_configs:
      - source_labels: [__meta_kubernetes_pod_annotation_prometheus_io_scrape]
        action: keep
        regex: true
      - source_labels: [__meta_kubernetes_pod_annotation_prometheus_io_port]
        action: replace
        target_label: __address__
        regex: ([^:]+)(?::\d+)?;(\d+)
        replacement: $1:$2
PromQL Query Examples #
Calculate request rate per second:
m
q
l
rate(http_requests_total[5m])
95th percentile latency:
m
q
l
histogram_quantile(0.95,
  sum(rate(http_request_duration_seconds_bucket[5m])) by (le)
)
CPU usage percentage:
m
q
l
100 - (avg by(instance) (
  irate(node_cpu_seconds_total{mode="idle"}[5m])
) * 100)
Memory usage in MB:
m
q
l
(node_memory_MemTotal_bytes - node_memory_MemAvailable_bytes) / 1024 / 1024
Error rate by endpoint:
m
q
l
sum(rate(http_requests_total{status=~"5.."}[5m])) by (handler)
/
sum(rate(http_requests_total[5m])) by (handler)
Disk usage prediction (will fill in 7 days?):
m
q
l
predict_linear(
  node_filesystem_avail_bytes[1h],
  7 * 24 * 3600
) < 0
Benchmarks / Real-World Use Cases #
Ingestion Performance #
| Setup | Samples/Second | CPU Cores | Memory |
|---|---|---|---|
| Prometheus single-node | ~100,000–300,000 | 4 | 2–4 GB |
| Prometheus + Cortex | 1M+ | Cluster | Scales horizontally |
| VictoriaMetrics (single) | Up to 1,000,000 | 8 | ~2 GB |
| InfluxDB 3.0 OSS | ~122,000 | 4 | 4–8 GB |
| InfluxDB 1.8 OSS | ~200,000–400,000 | 4 | 4–8 GB |
Source: Independent TSBS benchmarks, 2025–2026. Prometheus trades raw ingestion throughput for query flexibility and operational simplicity.
Resource Footprint by Scale #
| Cluster Size | Prometheus CPU | Prometheus RAM | Storage (30d) |
|---|---|---|---|
| Small (< 50 pods) | 500m | 1–2 Gi | 20–50 Gi |
| Medium (50–200 pods) | 1000m | 2–4 Gi | 50–100 Gi |
| Large (200–500 pods) | 2000m | 4–8 Gi | 100–200 Gi |
| XL (500+ pods) | 4000m | 8–16 Gi | 200–500 Gi |
Real-World Use Cases #
- DigitalOcean: Monitors thousands of VMs and Kubernetes clusters using Prometheus federation
- Uber: Scales to billions of time series with M3DB (Prometheus-compatible)
- SoundCloud: Original creator; monitors microservices at scale with minimal operational overhead
Advanced Usage / Production Hardening #
Security Best Practices #
- Enable Basic Authentication (Prometheus v2.24+):
a
m
l
# web.yml
basic_auth_users:
  admin: $2y$10$... # bcrypt hash
a
s
h
# Generate password hash
htpasswd -nBC 10 "" | tr -d ':\n'
Reference in startup flags:
a
m
l
command:
  - '--config.file=/etc/prometheus/prometheus.yml'
  - '--web.config.file=/etc/prometheus/web.yml'
- Use TLS for scrape targets:
a
m
l
scrape_configs:
  - job_name: 'secure-target'
    scheme: https
    tls_config:
      ca_file: /etc/prometheus/certs/ca.crt
      cert_file: /etc/prometheus/certs/client.crt
      key_file: /etc/prometheus/certs/client.key
      insecure_skip_verify: false
-
Network policies (Kubernetes) restrict which pods can reach Prometheus port 9090.
-
Run as non-root: The official image supports UID 65534 (nobody). From v3.10.0, a distroless variant uses UID/GID 65532.
Scaling Strategies #
- Federation: A global Prometheus scrapes aggregated metrics from regional Prometheus instances
- Remote Write: Stream metrics to long-term storage (Thanos, Cortex, VictoriaMetrics, Mimir)
- Sharding: Split scrape targets across multiple Prometheus instances by job or namespace
- High Availability: Run two identical Prometheus instances scraping the same targets; use Thanos Querier for deduplication
Monitoring Prometheus Itself #
m
q
l
# Scrape success rate
prometheus_target_scrapes_exceeded_sample_limit_total

# TSDB statistics
prometheus_tsdb_head_series
prometheus_tsdb_head_chunks

# Rule evaluation duration
prometheus_rule_evaluation_duration_seconds

# Alertmanager notification failures
prometheus_notifications_dropped_total
Long-Term Storage with Thanos #
Thanos extends Prometheus with object storage (S3, GCS, Azure Blob) for long-term retention and global querying:
a
m
l
# Sidecar runs alongside each Prometheus pod
- name: thanos-sidecar
  image: quay.io/thanos/thanos:v0.37.0
  args:
    - sidecar
    - --tsdb.path=/prometheus
    - --objstore.config-file=/etc/thanos/objstore.yml
  volumeMounts:
    - name: prometheus-data
      mountPath: /prometheus
    - name: thanos-objstore
      mountPath: /etc/thanos
Comparison with Alternatives #
| Feature | Prometheus | InfluxDB | Datadog | New Relic |
|---|---|---|---|---|
| License | Apache-2.0 | MIT | Proprietary | Proprietary |
| Cost | Free (self-hosted) | Free OSS / Enterprise $ | $15–$23/host/month | $0.25/GB + user fees |
| Deployment | Self-hosted, Docker, K8s | Self-hosted / Cloud | SaaS only | SaaS only |
| Data Collection | Pull (HTTP scrape) | Push (agent/write API) | Agent-based push | Agent-based push |
| Query Language | PromQL | InfluxQL / Flux / SQL | Custom / SQL | NRQL |
| Native K8s SD | Yes (built-in) | Via Telegraf | Yes (agent) | Yes (agent) |
| Long-term Storage | Thanos / Cortex / Mimir | Built-in (Enterprise) | Built-in (15 mo) | Built-in (13 mo) |
| Alerting | Alertmanager (native) | Kapacitor / Enterprise | Built-in | Built-in |
| AI/ML Insights | Community plugins only | Limited | Anomaly detection | Full AI analysis |
| Ingestion (1 node) | 100K–300K samples/s | 122K–400K metrics/s | N/A (SaaS) | N/A (SaaS) |
| Best For | K8s, infra monitoring, DevOps | IoT, high-cardinality metrics | Enterprise multi-cloud | APM, AI-driven ops |
When to choose Prometheus: You run Kubernetes, want full control over your data, need to avoid per-host licensing costs, and have the operational capacity to self-host. Prometheus excels at infrastructure metrics, container monitoring, and custom application instrumentation.
When to choose a competitor: You need fully managed APM with distributed tracing out-of-the-box (Datadog/New Relic), or you handle high-cardinality IoT workloads where InfluxDB’s columnar engine fits better.
Limitations / Honest Assessment #
Prometheus is not a universal monitoring solution. Be aware of these constraints before committing:
-
No native log aggregation: Prometheus handles metrics, not logs. You need Loki, ELK, or Fluentd for log management. The “metrics, logs, traces” trilogy requires additional tools.
-
Single-node limitations: A single Prometheus server can handle roughly 100,000–300,000 samples/second depending on hardware. Beyond that, you need federation or remote-write solutions like Thanos, Cortex, or VictoriaMetrics.
-
No built-in long-term storage: Default local storage is limited by disk size. For retention beyond months, you must integrate external object storage.
-
Pull model constraints: Monitoring short-lived batch jobs or serverless functions requires Pushgateway or OTLP ingestion — adding complexity.
-
High cardinality is expensive: Metrics with too many unique label combinations (e.g., user IDs as labels) can explode memory usage and degrade query performance.
-
Learning curve: PromQL requires investment. Engineers familiar with SQL will need time to adjust to vector-based queries.
Frequently Asked Questions #
Q: What is the difference between Prometheus and Grafana? A: Prometheus collects and stores metrics; Grafana visualizes them. They are complementary tools, not competitors. Prometheus includes a basic expression browser, but Grafana provides the dashboards, alerting UI, and multi-source analytics that production teams need.
Q: How do I monitor a Python application with Prometheus?
A: Use the official prometheus-client Python library to expose a /metrics endpoint on your application, then configure Prometheus to scrape it. For Flask apps, use prometheus_flask_exporter. For Django, use django-prometheus.
Q: Can Prometheus handle high availability? A: Yes, but it requires an external solution. Run two identical Prometheus instances scraping the same targets, then use Thanos Querier or Cortex for deduplication and global querying. Prometheus itself does not cluster natively.
Q: What is the maximum retention period for Prometheus data?
A: Local storage retention is configurable via --storage.tsdb.retention.time (default 15 days). Practical limits depend on disk size. For multi-year retention, use remote write to Thanos, Mimir, or object storage.
Q: How does Prometheus compare to cloud monitoring solutions like CloudWatch? A: Prometheus offers more flexible querying (PromQL vs CloudWatch Insights), dimensional labels, and no per-metric pricing. CloudWatch integrates natively with AWS services and requires zero operational overhead. Many teams use both: CloudWatch for AWS resources, Prometheus for application and Kubernetes metrics.
Q: What are recording rules and when should I use them?
A: Recording rules pre-compute expensive PromQL expressions and store results as new time series. Use them for dashboards that load slowly or queries that run frequently. Define them in *.rules.yml files and reference them in prometheus.yml under rule_files.
Q: Is Prometheus suitable for monitoring IoT devices? A: Only if devices expose HTTP endpoints and are reachable by the Prometheus server. For edge/IoT scenarios with intermittent connectivity, a push-based system like InfluxDB or MQTT-based telemetry may be more appropriate.
Conclusion #
Prometheus remains the gold standard for cloud-native monitoring in 2026. With 64,094 GitHub stars, active CNCF backing, and a release cycle that keeps improving performance (PromQL heap allocation reductions, native histogram stabilization, Remote Write 2.0), it is a safe long-term investment for infrastructure observability.
Action items:
- Clone the
kube-prometheus-stackHelm chart and deploy to your staging cluster - Import Grafana dashboard 1860 for immediate Node Exporter visibility
- Write three alert rules for your critical services
- Join the dibi8 Telegram Group for daily open-source tool updates and deployment tips
Hosting recommendation: Deploy Prometheus on DigitalOcean Kubernetes ($12/month for a managed control plane) for a cost-effective, production-ready monitoring stack. For dedicated cloud resources, check out HTStack hosting solutions optimized for container workloads.
Disclosure: This article contains affiliate links. If you purchase services through these links, dibi8 may earn a commission at no additional cost to you.
Recommended Hosting & Infrastructure #
Before you deploy any of the tools above into production, you’ll need solid infrastructure. Two options dibi8 actually uses and recommends:
- DigitalOcean — $200 free credit for 60 days across 14+ global regions. The default option for indie devs running open-source AI tools.
- HTStack — Hong Kong VPS with low-latency access from mainland China. This is the same IDC that hosts dibi8.com — battle-tested in production.
Affiliate links — they don’t cost you extra and they help keep dibi8.com running.
💬 Bình luận & Thảo luận